


How do mortgage rates rise
And how they impact property prices

What causes mortgage rate increases?
What’s on our mind: This week we do a deep dive into how mortgage rates are priced and what causes them to increase. We also try to predict where we think mortgage rates will be in 6 months' time and how property prices will be impacted.
What happened this week: Key quotes from RBA governor Phillip Lowe’s speech
“Australians should brace themselves for more interest rate hikes”,
“The Board are committed to doing whatever it takes to return inflation to 2-3%”
“I anticipate discussing 25bp or 50bp at the July meeting as well”.
What are we watching next week: Private sector credit growth data (Aus), US FED chair speech.
Prelude:

What’s on our mind:
What drives property prices?
The media machine has been working around the clock with negative headlines about property prices almost daily.
Headlines ranging from “more pain is on the horizon for homeowners” coupled with predictions from market pundits claiming 20-30 and, in some extreme scenarios, 70% peak to trough price declines in property prices.
But on the ground, the reality is a whole lot different.
Property prices on an aggregate basis may be down a few % for 2022, but there are still some properties selling for well in excess of similar properties transacted in 2018 and even 2021.
We have seen properties in the $1.5m to $3m range come off by up to 10%, but there is still a lot of resilience in the market <$1m.
We are seeing fewer buyers for each property, but many people are still sitting on the sidelines with an appetite to purchase a property.
The psychology of buyers is very much one of “buy the dip” with the expectation that this is just a typical lull in the Australian property market which will rebound strongly in the long run.
The way properties are being sold also reflects this.
We have gone from a market where real estate agents would market the property with a lower than expected price to bring in more interest to a market where agents set more realistic expectations to condition the buyer into thinking they bought the property at a discount.
The buyers who go into an auction thinking “the agent wants more than the guided range” are happy to bid in the range, seeing this as unattainable in 2020-2021, a phenomenon where buyers are seeking the feeling of purchasing a “bargain”.
Coming back to the point we are trying to make. With all this talk of property prices collapsing, why aren't prices falling off a cliff?
The simple fact is that property prices are most correlated to TWO things:
Mortgage rates - The interest rate at which the bank is willing to lend to a borrower
Credit growth - The aggregate amount of new lending banks are cranking out. (To see our previous article touching on this, check out the following link: What happened in 2021 stays in 2021
Today’s article will focus on the 1st driver - Mortgage rates.
First, we will try and work out how banks determine the interest rate they charge customers.
Given that banks are in the business of lending, we will do a deep dive into a bank's profit margin (net interest margin) and work out how much it costs them to fund a loan.
After breaking down the cost drivers for loans, we will then try and forecast where the market is telling us mortgage interest rates are headed over the next six months.
The focus is to try and answer the following questions:
Why haven't prices fallen off a cliff with so much negative news around?
How are interest rates for mortgages set?
What is the outlook for mortgage rates and the property market over the next six months?
We will answer these questions as concisely as possible right at the end of today’s article after our deep dives into how mortgage interest rates work.
How are Interest rates for mortgages set?
So let’s start with mortgage rates.
The current interest rates on offer from the major lenders are near the lows in the entire history of Australia. They may have started to pick up in recent months, but if we zoom out and look at the last 30 years, they are still near record lows.
If we think interest rates are one of the most important leading indicators for the direction of property prices, then we believe there is value in understanding how they are set.
The question that needs answering then becomes, “how does a bank set an interest rate when writing a new loan?”.
First of all, the banks are in the business of lending money.
This means they make revenues by collecting interest on loans they give borrowers.
The aim of the game is to find as many credible borrowers as possible, loan them money and then collect the interest.
The second part of the equation concerns how banks fund these loans - the expenses.
Through a mixture of funding sources (which we will do a deep dive on later in today’s article), banks pay a % rate on every dollar that is loaned out.
For the purposes of today’s article, we will call these the banks “funding costs”.
Bringing this all together, the bank collects interest at a % rate (revenues) and then pays out funding costs at a % rate (expenses) on every dollar they loan out to customers.
In Australia, the difference between the interest received and the funding costs paid out is called a “Net Interest Margin” - think of this as a bank's profit margin.
The RBA’s most recent data (8th of June 2022) has the major banks “Net Interest Margin” at ~2% as per the following chart:

Since 2005, net interest margins for the major banks have been between 2 and 2.5% - so we can assume that a bank's long-run margin target is somewhere in this range.
For the purposes of today’s article, we will assume that a bank's TARGET net interest margin is 2.25%.
No matter what happens, banks will do everything they can to try and defend their net interest margin, which will result in banks passing onto customers any increase/decrease in their funding costs.
If funding costs go up, the banks will increase the interest rate they charge customers on variable rate loans. Alternatively, if funding costs decrease, they will pass this on through lower interest rates (like we saw in 2020-2021 and for much of the last three decades).
Basically, a bank's decision to change the interest rate it charges its customers has less to do with a desire to make more profits and more to do with a bank's willingness to defend/protect its net interest margin at the all-important 2.25%.
Knowing what we know now, the equation to determine where a mortgage rate will be sounds relatively simple. It is about working out the bank's funding cost and then adding 2.25% to it.
The question is, though, what drives a bank's funding costs?
If we can work this out, we can approximate a near enough guess for where we think mortgage interest rates are headed, and in turn, we will get to know what drives increases/decreases them.
Knowing the specific indicators to keep an eye on can mean we can forecast (to the best of our ability) the direction in which mortgage interest rates might be headed (Increase or decrease) and use that information to make more informed decisions.
For an investor, it would be a way of working out whether or not to lever up for purchases or look to sell down and reduce leverage.
For homeowners, it would help when deciding how much to spend on a new home and the amount of debt someone would be willing to take on.
The assumption being if rates are headed lower, someone would be more willing to take on more debt; if rates are headed higher, then less so.
What drives bank funding costs?
So what drives bank funding costs?
Let's try and keep it as simple as possible here. (emphasis on the word try here)
Banks are complex beasts, and we definitely don't have enough brainpower to forecast banks' funding costs in real-time.
We start by looking at the chart below, released by the RBA, which gives us a breakdown of the “funding composition” for major banks:
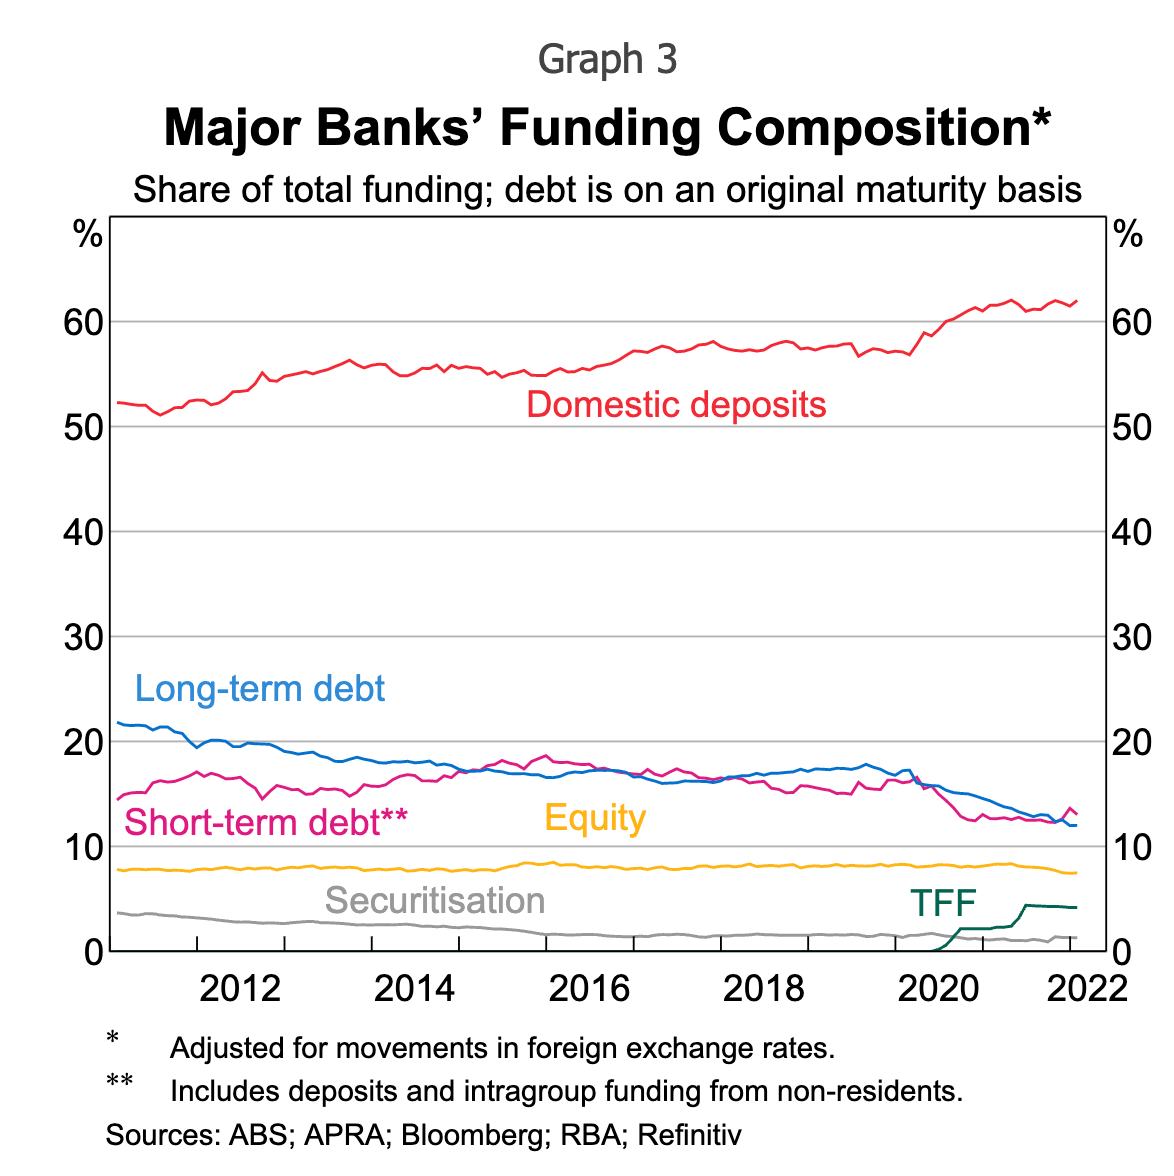
From this, we can see that banks' fundings currently come from 6 different sources.
First is domestic deposits, which comprise ~60% of a bank’s funding.
These are mostly comprised of term deposits or savings accounts customers have at the banks.
The funding cost on these domestic deposits is the % interest the banks pay for customers to keep their cash in their accounts. Those interest rates are always loosely based on the RBA cash rate.
So for the purposes of today’s article for domestic deposits, we will use a funding cost equal to the RBA cash rate of 0.85%.
Second is the long-term debt which makes up ~12.5% of a bank’s funding.
Banks are regular businesses’, and so they also take out loans.
The loans termed “long-term debt” are the ones where banks have maturities above 5-10 years.
For the purposes of today’s article for the long-term debt, we will use a funding cost equal to the 10-year Australian government bond yield of 3.7%.
Third is the short-term debt which makes up ~12.5% of a bank’s funding.
This is identical to “long-term debts”, except the maturities are typically <5 years.
For the purposes of today’s article for the short-term debt, we will use a funding cost equal to the 2-year Australian government bond yield of 2.7%.
Fourth is equity which makes up ~7.5% of a bank’s funding.
This is the amount of shareholder funds used to finance the bank's operations.
In equity markets today, a typical equity investor will demand a ~8% return, so for the purposes of today’s article, we will use a funding cost for equity of 8%.
Fifth is securitisation which makes up ~2.5% of a bank’s funding.
This one is a bit complex but, in many ways, is similar to long-term debt.
For the purposes of today’s article for securitisation, we will use a funding cost equal to the 10-year Australian government bond yield of 3.7%
Sixth is through the RBA’s Term Funding Facility “TFF”, which makes up ~5% of bank funding.
This is a unique facility that the Australian government set up in 2021 to encourage banks to write more loans.
The funding cost of this facility was set at 0.1%.
So the approximate split and the interest rate (funding costs) on these are as follows:

After multiplying these by their respective weightings, we can calculate banks' APPROXIMATE weighted average funding cost of ~2.2%.
This exercise allows us to calculate (at a very high level) an estimate for where a bank's funding costs sit at any given time - that is, the % of expenses a bank pays on each loan they write.
Now we need to put our banker hats on.
If we have a funding cost of ~2.2% and want to make a net interest margin on every loan of 2.25%, what interest rate do we need to charge on mortgages?
The answer is ~4.45%.
The formula that a banker would use when determining an interest rate on a loan is therefore relatively simple:
(1) Funding costs + (2) Net interest margin = (3) Mortgage rate offered to new borrowers.
As of today, that number sits at:
(1) Funding costs 2.2% + (2) Net interest margin 2.25% = (3) Mortgage rate offered to new borrowers 4.45%.
(For the banking analysts, we know other complex factors like risk weightings etc., that need to be considered. This is all high-level guesstimation works. We are not trying to forecast it to the nearest decimal place)
What do the next six months look like for the property market?
Having done all that work to state the obvious (where mortgage rates are currently at).
We can now plug in future estimates into the equation to get an approximate idea of where we think a bank’s funding cost will be at a particular time in the future and, in turn, determine where mortgage rates are headed.
The next part of the exercise is to try and predict where we think the bank’s funding costs will be in the next six months:
We start by establishing that the primary funding source for banks is “domestic deposits”, which make up ~60% of banks' funding and long/short-term debt, which makes up a combined ~25%.
We have already covered the movements in the long/short-term debt markets in our last article, which you can read here: Bonds & the property market.
The more interesting driver is domestic deposits - The single biggest driver of banks funding costs making up a whopping ~60% of the funding.
As we touched on earlier, the funding costs for domestic deposits are loosely based on the RBA cash rate.
With the RBA only two rate hikes into this hiking cycle, it is still early days with a creep up in costs here.
This means that the last domino to fall and set off exponential increases in banks' funding costs is the RBA cash rate.
The chart released by the RBA below shows just how correlated the two are:

The fact is that the higher the cash rate goes, the higher funding costs go.
Now let's remind ourselves where the markets are pricing the RBA cash rate by December this year:

This might seem like an extremely high number, but the quotes from RBA governor Phillip Lowe in a speech earlier this week said that “Australians should brace themselves for more interest rate hikes” & that “The Board are committed to doing whatever it takes to return inflation to 2-3%”.
Lowe also mentioned that he anticipated “discussing 25bp or 50bp at the July meeting as well”, meaning we should expect to see the first rate rise in only a few weeks time.
All of this is part of the RBA’s signalling to markets that they are serious about increasing the RBA cash rate this time.
If we plug in the market expectation of a 3.1% cash rate, our calculator gives us a weighted average funding cost for the banks of ~3.5%.

Now the final step.
Using our formula for mortgage interest rates (with the implied December cash rate), we get the following:
(1) Funding costs 3.5% + (2) Net interest margin 2.25% = (3) Mortgage rate offered to new borrowers 5.75%.
From our discussions with property developers, real estate agents and property investors no one thinks mortgage interest rates will be this high come December.
We can sense the complacency in the property market, with gurus calling on the public to “buy the dip” in Australian real estate.
The reality is that the “dip” will continue until the RBA is done, increasing the cash rate, and mortgage interest rates have peaked.
We think this complacency will make the pain from higher interest rates much more surprising and unbearable.
Of course, our view could be completely wrong.
We think that the probabilities are skewed in favour of declining property prices as interest rates rise in the second half of this year and choose to be prepared for this scenario instead of being surprised.
The answer to the questions we asked earlier:
So what are the answers to the three questions we asked ourselves before our deep dive:
1. Why haven't prices fallen off a cliff with so much negative news around?
Simply because the single biggest driver of mortgage interest rates is the RBA cash rate.
As the cash rate increases, mortgage interest rates will increase in tandem.
As mortgage interest rates increase, loan growth will slow, and the ability of borrowers to take out larger loans will decrease.
We expect prices to fall in line with increases in the RBA cash rate.
2. How are interest rates for mortgages set?
Banks are in the business of lending money; they make revenues by collecting an interest rate and paying “funding costs” to finance these loans.
We broke the mechanics of a mortgage by defining the following:
Revenues = Mortgage interest rate
Expenses = Funding costs
Profit margin = Net interest margin
Our formula for calculating where mortgage rates are likely to be is as follows:
(1) Funding costs x% + (2) Net interest margin y% = (3) Mortgage rate offered to new borrowers z%.
3. What is the outlook for mortgage rates and the property market over the next six months?
Based on the current market forecasts of a 3.1% RBA cash rate in December this year, our formula is telling us interest rates on mortgages could go as high as 6% (it could go higher).
We think that increases in mortgage rates will inevitably lead to price declines.
We could be wrong, but we prefer being prepared for a higher interest rate environment than taking our chances on it, not eventuating.
In any case, the direction for the RBA cash rate and mortgage interest rates is HIGHER.