


A trip down memory lane
What’s on our mind: Today we recap the last 5 years in the Australian property markets and finish off with where we find ourselves today.
What happened this week: The RBA unexpectedly lifted the cash rate by 0.5%.
What we are watching next week: US Fed fund rate decision, UK fund rate decision, Westpac consumer sentiment survey, Australian unemployment figures, Melbourne Institute inflation expectations, RBA bulletin release.
Prelude:

What’s on our mind:
2017-19 - The bear trap:
Today’s write-up will focus on the Sydney & Melbourne markets, mainly because we think these two are the most correlated, and comparing them with Hobart for example would be unfair.
The journey begins at the end of the June quarter of 2016.
The median house price in Sydney is sitting at ~$1,040,000 and in Melbourne at ~$730,000.
Fast forward 12 months, in June 2017 prices are up ~14%
Using a $1,000,000 home as an example that is a ~$140,00 gain in 12 months, more than some Australians could only dream about earning in a year.
The frenzy in markets continues for the next few months.
At the same time, the prime minister at the time calls for a Royal Commission into “Misconduct in the Banking, Superannuation and Financial Services Industry” starting on the 14th of December 2017.
Over the next 2 years, the Royal Commission puts the entire financial services industry under the microscope.
The findings uncover problems around bribery, forged documentation, mis-sold insurance, and (this one is important for the property market) breaches of responsible lending practices.
That last one is particularly important for property prices.
The final report (which was published in January 2019) showed that the big four banks “took some steps to verify the income of an applicant for a home loan” but also found that “more often than not, none of them took any step to verify the applicant's outgoings”.
So the bankers were assessing borrowing capacity without asking how much the borrowers have left over each month.
So if you earned $75,000 per annum but spent $70,000, the bank would still make a loan to you using their assumptions for how much you spend.
What came next for the big four banks was a 12-18 month period where lending tightened and borrowing to buy a home was becoming increasingly difficult.
The chart below shows how property lending started to slow, with credit growth approaching 0% for investors and ~5% for owner-occupiers.
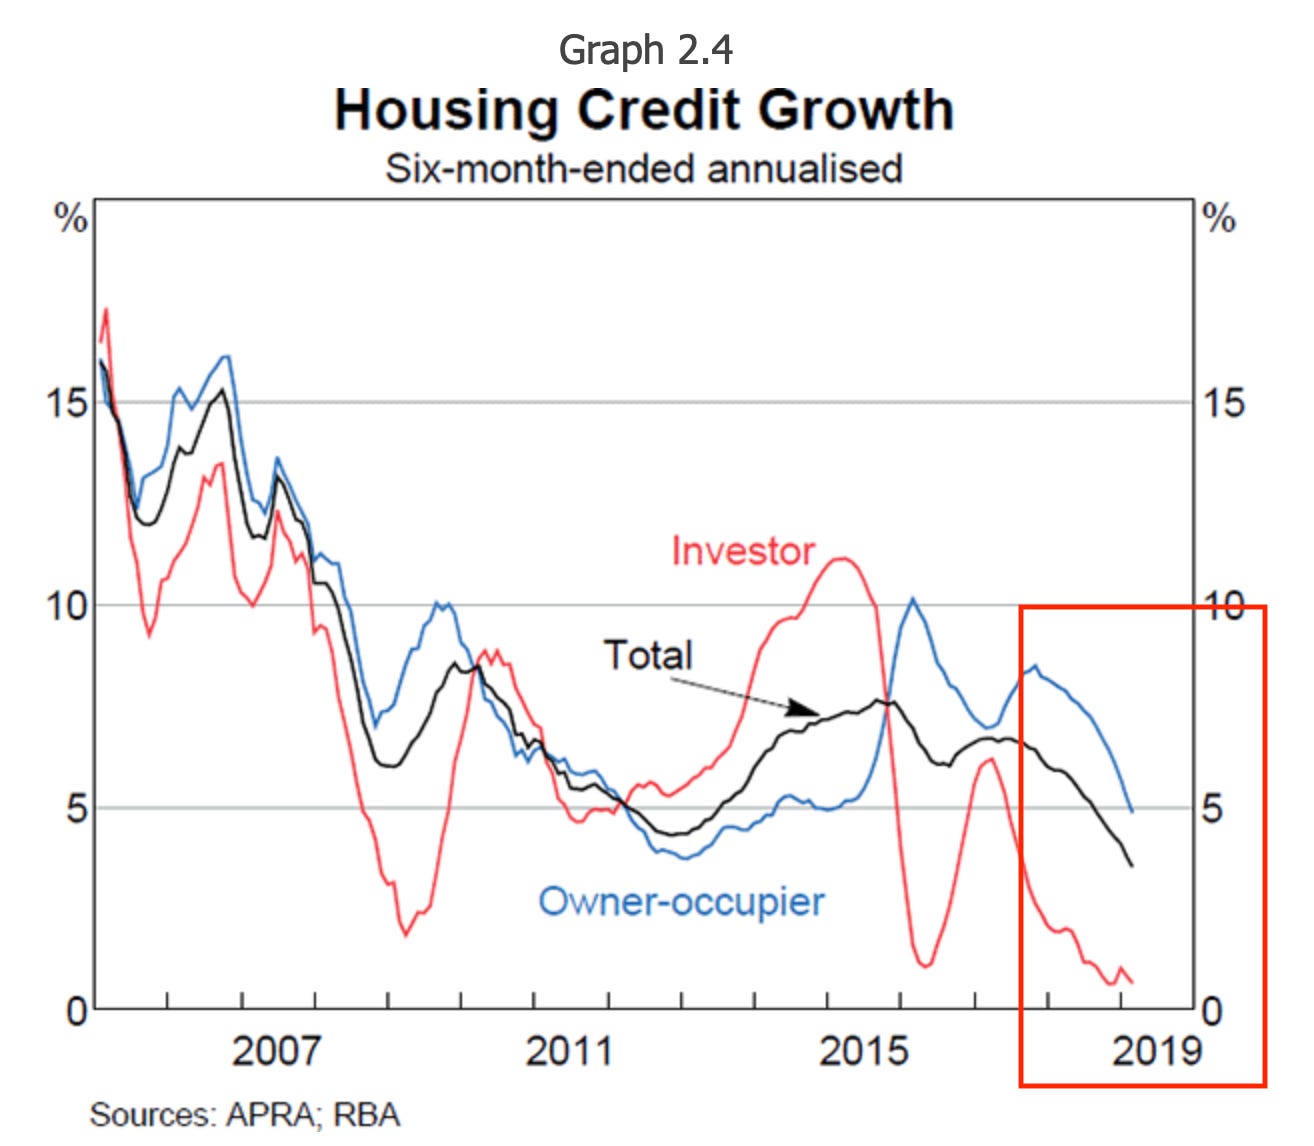
From the end of 2017 to the end of June 2019, the Australian Bureau of Statistics (ABS) had the Sydney property prices down ~12% and Melbourne prices down ~10%.
The market was so bad that even the RBA covered it by releasing a paper in April 2019 titled “Housing Price Falls and Negative Equity” which said, “Large housing price falls in parts of Australia mean some borrowers are facing negative equity”.
So the banking industry was investigated, banks stopped making risky loans and property prices started falling….
It was a shaky market but if we had to put a rating on the level of panic we were seeing it was barely at 5/10.
The Federal government wasn’t at a 5, it responded to the ~76 recommendations made by the Royal Commission by choosing to ignore ~45 and completely abandoning four of them.
Basically, after 2 years of investigations and 76 recommendations later, more than half of the report's findings had been ignored.
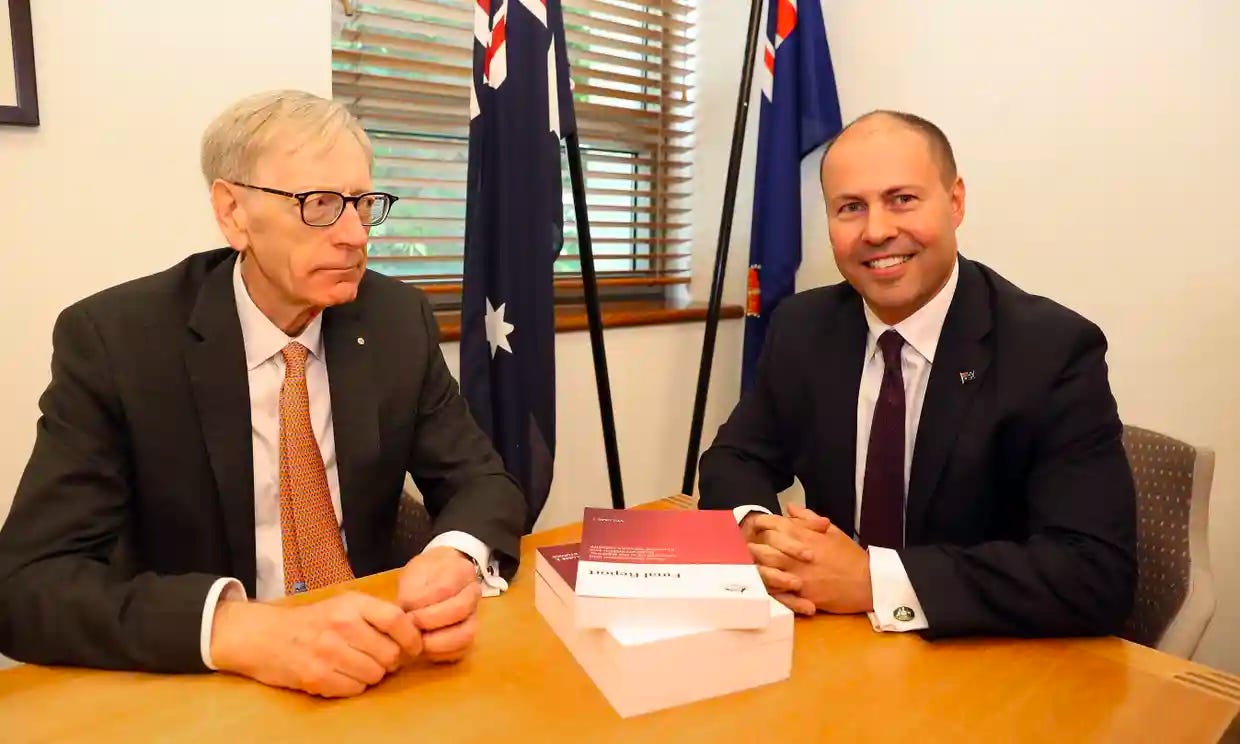
This picture of the treasurer at the time and Kenneth Hayne who led the commission says it all in our opinion.
Noticing the slowdown in the economy and the slowdown in property prices the RBA started cutting interest rates to try and get the party going again.
At its June 2019 meeting the RBA cut rates by 0.25%, in July it cut rates again by another 0.25% and then in October, it cut rates one last time by another 0.25%.
In 4 months the cash rate had gone from 1.5% to 0.75% - a halving of the cost of money.
Naturally, this made borrowing less expensive and just like clockwork, In the second half of 2019 property prices started to creep back up.
Lending conditions were improving and borrowers were now qualifying for bigger mortgages which could be serviced a lot easier now that the cash rate was half of what it was in May of the same year.
It was more of the same until March 2020.
2020 - The COVID pandemic:
Then COVID happened.
The world went into lockdown, and Australians were banished to their homes with no release date in sight.
Those lucky enough to transition into a virtual office did so, and those who couldn't were left without an income and no visibility as to when they could start working again.
With the economy switched off, banks stopped lending.
Borrowing markets were closed for business, just like the rest of Australia.
All eyes were now on the already fragile Australian property market; would prices fall, stay the same or go up?
After all, prices even went up following the global financial crisis (GFC) in 2008-9. The assumption was that COVID would come and go and property would remain unscathed.
It wasn't just the everyday Australian watching house prices. The RBA was so fixated on housing that one RBA economist wrote the following to his colleagues:

Internally at the RBA economists were so worried that prices would fall they considered calling for a complete pause in all property transactions to avoid the Australian public seeing prices fall.
In other words, if they could stop transactions then no one would see the impact frozen lending markets would have on property prices.
This is all from the Reserve Bank Of Australia, If they were this worried things must have been looking pretty bad...
2020 - The COVID response:
Desperate times call for desperate measures.
The next 9-12 months saw unleashed a period of loose monetary conditions never before seen in Australian history.
The banks had stopped lending and the government decided it needed to intervene to unfreeze lending markets.
First, we saw the RBA cut interest rates twice in the same month (March 2020) from 0.5% to a record low of 0.1%.
Second, we saw the RBA offer the big four banks a “term funding facility” which ended up providing $188 billion in funding at a 0.25% interest rate over a 3-year fixed term.
The facility had two main objectives:
Reduce the funding costs so the banks could pass this onto the public via lower borrowing rates. (The idea here was that lower borrowing rates would entice more borrowing).
Encourage lending from banks to business customers. (The government even decided to guarantee some of these loans).
These measures were the RBA’s response to try and get credit flowing into the economy again.
On top of this, the federal government got involved and pumped ~$507 billion of additional support into the economy of which ~$257 billion was direct economic support.
A sign of the obsession with property in Australia, as if all of this wasn't enough, the Australian government even offered Australians a $25,000 homebuilder grant (encouraging more borrowing/spending in the property markets).
So just like that, we went from tight monetary conditions to arguably the loosest in Australian history.
2021 - The post-COVID euphoria:
First the stats for the year.
Between December 2020 and December 2021 we saw property prices in Sydney rise by ~27% and in Melbourne prices were up ~22%.
For a Sydney homeowner with a $1,000,000 home that is a ~$270,000 gain in 12 months - $740 per day in price appreciation.
This would have seen most Sydney property owners make more money (on paper) by holding onto their property than they would be working for several years.
All of this happened in a country where wages only grew ~2.3%, so clearly, wages had nothing to do with these astronomic gains.
But we have already established wages make up a small part of why property prices increase.
As we have eluded to for the whole of today's write-up, the price growth can only be explained by looking at CREDIT GROWTH.
Faced with loose lending conditions, record low-interest rates & a government willing to pump as much money into the economy as humanly possible credit growth in 2021 bounced back extremely strongly.
The chart pack from the RBA below paints the picture.
Owner-occupier lending was >7%/annum.
Investor lending was ~7%/annum.
Business lending was running at >7%/annum.
The most interesting takeaway from this chart pack is the fact that both business and investor lending was negative going into 2021.

The massive pick-up in lending is no surprise given the lending rates on offer…
The chart below shows how 3-year fixed interest rates for housing hit all-time lows near ~2%.
The shorter-term fixed rates were even lower, some Australians would have managed to fix their loans for 1-2 years at rates as low as ~1.8%.

Here is an example of how a purchase would have looked in this rate environment:
Person A buys a home in 2021 for $1,000,000 and takes out a loan for 80% of the purchase price, leaving them with an $800,000 mortgage.
The interest repayments on this loan taken out in 2021 with a 3-year fixed rate of 2% would see person A pay $16,000 per annum in interest … Less than ~$1,350 per month.
In some parts of Sydney and Melbourne, this is less than one week's rent...
Person B buys a home in 2022 for $1,000,000 and takes out a loan for 80% of the purchase price, leaving them with an $800,000 mortgage.
The interest repayments on this loan taken out in 2022 with a 3-year fixed rate of 4% would see person A pay $32,000 per annum in interest … Less than ~$2,700 per month.
All of a sudden that rental looks a little more enticing.
Throw in principal repayments and the difference between the two loans can be enough to wipe out a family’s disposable income or force borrowers to wind back spending.
So the property price appreciation in 2021 had nothing to do with all of the usual things we are led to believe (immigration, supply and demand etc).
It is a lot simpler to explain…
The astronomic price growth of 2021 was a simple function of easy money, low-interest rates and extraordinary government stimulus.
2022 - Where do we find ourselves now?
All of this brings us to where we find ourselves today.
The RBA has just increased the cash rates twice in two months and was extremely aggressive this week, hiking rates by 0.5%.
The cash rate now sits at 0.85%, above where it was pre-pandemic.
To make matters worse, the big four banks are tightening the purse strings and guiding for even more rate hikes in the second half of this year.
Below is an image of where the market expects the cash rate to be for the remainder of the year.

If this is anything to go by then we are expected to see the RBA cash rate at 3.05% after the RBA’s December meeting.
This would mean interest rates on mortgages would be sitting above 5-6% per annum.
Just going off that example of an $800,000 mortgage.
If we get to December and the RBA cash rate is anywhere near 3% and mortgage rates are at 6% then that same borrower would be paying $48,000/annum in interest… Almost $4,000 per month.
Of course, it is impossible to predict where the RBA cash rate is, even the RBA has struggled to get it right in the past. We still remember when the governor was saying there would be no rate rises until 2024.
One thing is for sure though, the outlook for credit growth isn't looking that great, and we all know what that means for property prices…
In summary, the property market is no different to other asset classes and also goes through different “market cycles”.
We will leave everybody with the following image.
We think we know where the last 5 years fit on this chart, the question is where do you think we are now?
