

Why we think the market is nowhere near the bottom
Why we think the market is nowhere near the bottom
At The Real Estate Gym training FOMO today

Did something change? why are people calling for a bottom?
What’s on our mind: Real estate influencer Tom Panos calling the bottom? We have a different view…
What happened this week: US central bank governor thinks global rates are headed much higher than anyone thinks.
What are we watching next week: RBA Cash rate decision (Tuesday 6th September), European cash rate decision, Canadian cash rate decision.
Prelude:

What’s on our mind:
This week we saw the following video from real estate influencer Mr Tom Panos.

He followed that up with an article in the Daily Telegraph where he laid out his thesis on why time is running out to pick up bargains in Australian property.
In that article, he made a forecast saying, “We are very close to the end of the correction” in property prices.
He then listed four key reasons that helped him form that judgement.
Today, we will respond to those reasons Tom mentions with our take and how we think Tom’s brave call will age.
Before going any further, for anyone who doesn't know, here is Tom’s bio as per his Twitter page:
(For the record, we had multiple attempts at writing one but failed every time, TLDR: Tom can do it all, and we have a lot of respect for him here at Aus Property).

One of the most influential names in the Australian property industry (especially amongst real estate agents) has officially called that we are close to the bottom.
He used the analogy of a clock to describe where he thinks we are, saying the following:
“If it’s a clock, with 12 being the top and six being the bottom, I’m calling it a five, so the end is close. There’s still a bit to happen, but it’s around five on the clock and not far from the bottom.”
So Tom thinks we are at a five on the clock, basically a tick away from the bottom.
Panos, who claims to have called the 2020-2021 bull run and the subsequent slow down starting in October 2021, is now making another brave call.
According to the latest CoreLogic data, house prices in Sydney are down 7.3% and in Melbourne down 4.5%.
This compares to price falls across major cities in New Zealand and Canada, which are down almost 20%.
Tom does caveat the call saying he can see specific scenarios resulting in a further 5-7% before we see an absolute bottom which would see us go on par with the price falls seen across both those countries.
Nevertheless, he has now put it on the record (dated 20 August 2022) that we are close to the end of the great Australian property correction.
Here are the four reasons Tom lists to back up his call:
Interest Rate Movement - Tom believes a slowdown in rate rises or a pause will slow down price falls and lead to a bottoming out.
Long-Term Fixed Rate Movement - Tom believes that discounted fixed-term mortgage rates from the banks are a sign rates will fall in the long run.
Distressed Vendor Selling - Tom believes that strong employment will lead to little to no distressed selling.
Supply of New Listings - Tom believes vendors will stop listing properties, creating a supply shortage.
Read on to see what we think about all of this.
Our take on Tom Panos’ four key reasons:
Interest Rate Movement
Tom starts his article by saying, “If the current trend of 0.5 per cent interest rate increases continues for the remainder of 2022, we will see further declines in prices”.
We tend to agree with him here despite Tom stating the obvious.
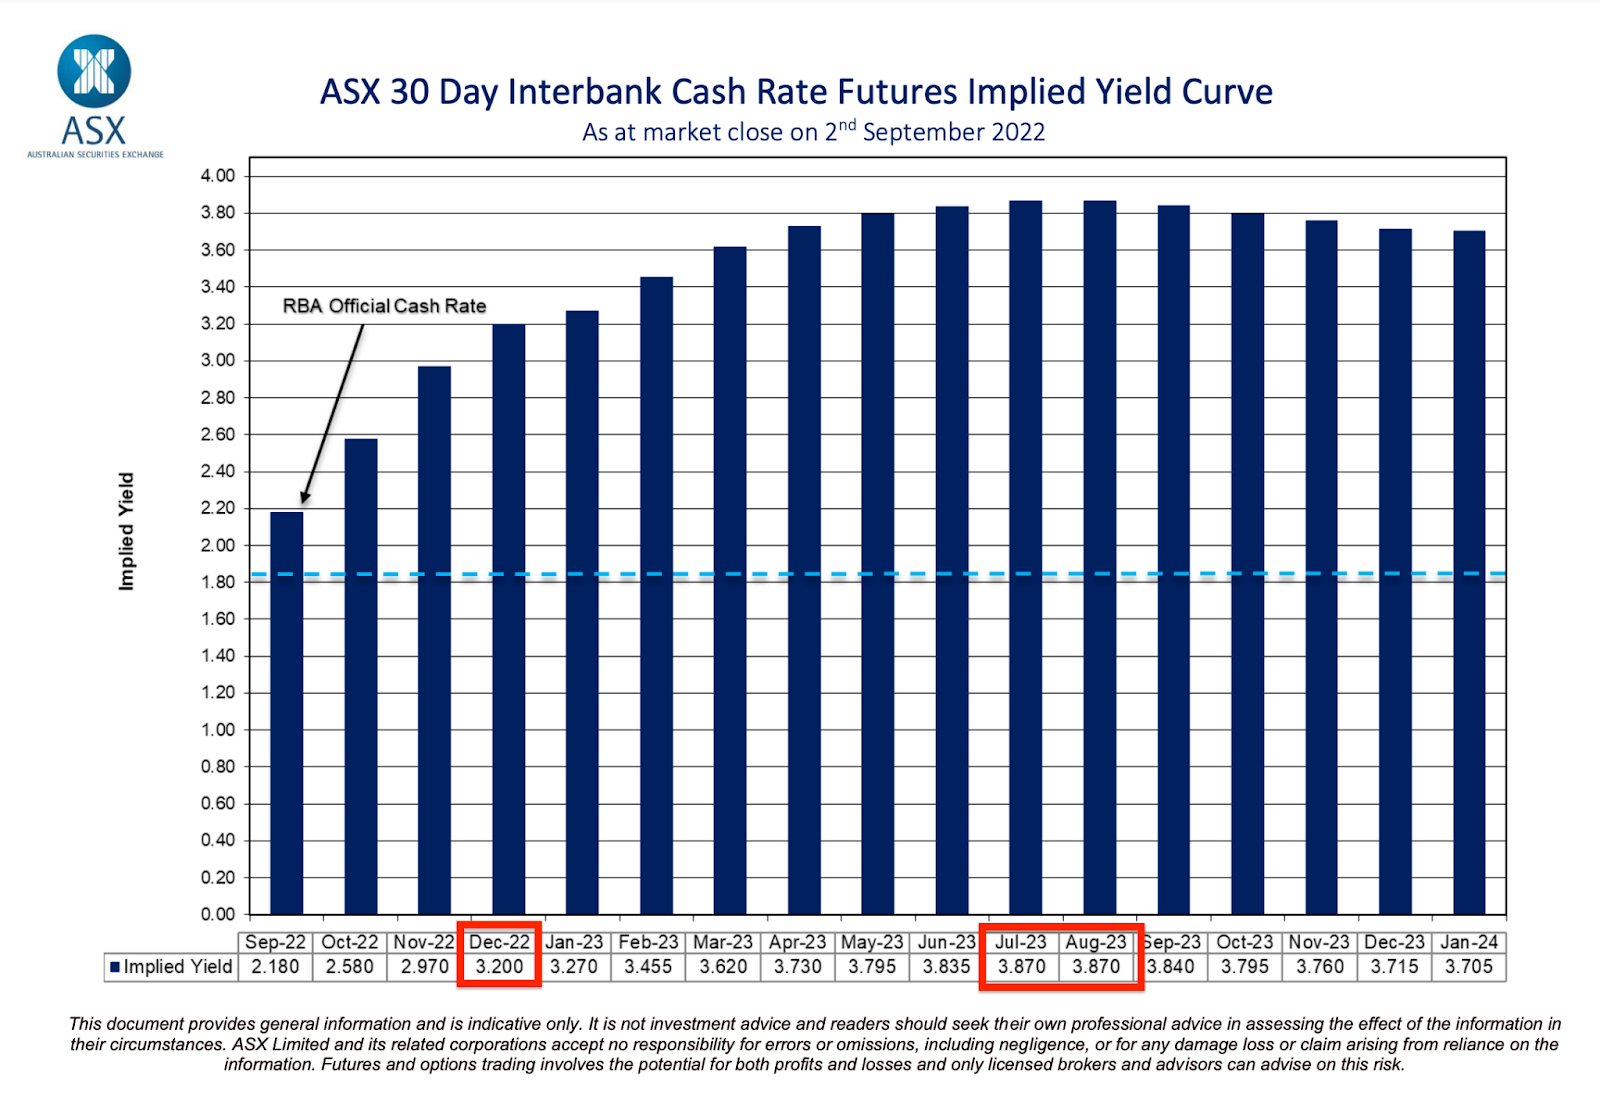
For context, the chart below predicts rates will continue to rise, reaching ~3.2% by December this year (1.35% higher than today) and then a peak of ~3.87% in July 2023 (~2% higher than today).
So he would agree that prices should continue to fall…
Tom also says that “if the Reserve Bank of Australia (RBA) slows those increases, we will probably see lower – or little – price declines”.
This is where we disagree with Tom.
We think the market takes time to react to structural changes to monetary policy.
For example, in March 2020, when the RBA cut the official cash rate to 0.1%, home prices didn't react in any way, in fact they continued to stagnate/fall up until ~June 2020.
It took the market ~18 months through to October 2021 to reach a peak.
This is why we think that IF the RBA stopped raising rates or started to slow the magnitude of rises, house prices could continue to fall.
It is because the markets simply aren't able to price in changes to the cash rate instantly, they are more likely to price them in over an extended period of time.
Our view is that prices continue to fall for at least another 6-9 months after rates have peaked.
The key indicator we are watching on this front is housing credit.
As mentioned in a previous article, we believe the credit cycle drives house prices, so increases/decreases in housing credit dictate the direction of home prices.
(Click here to read that article: What happened in 2021 stays in 2021)
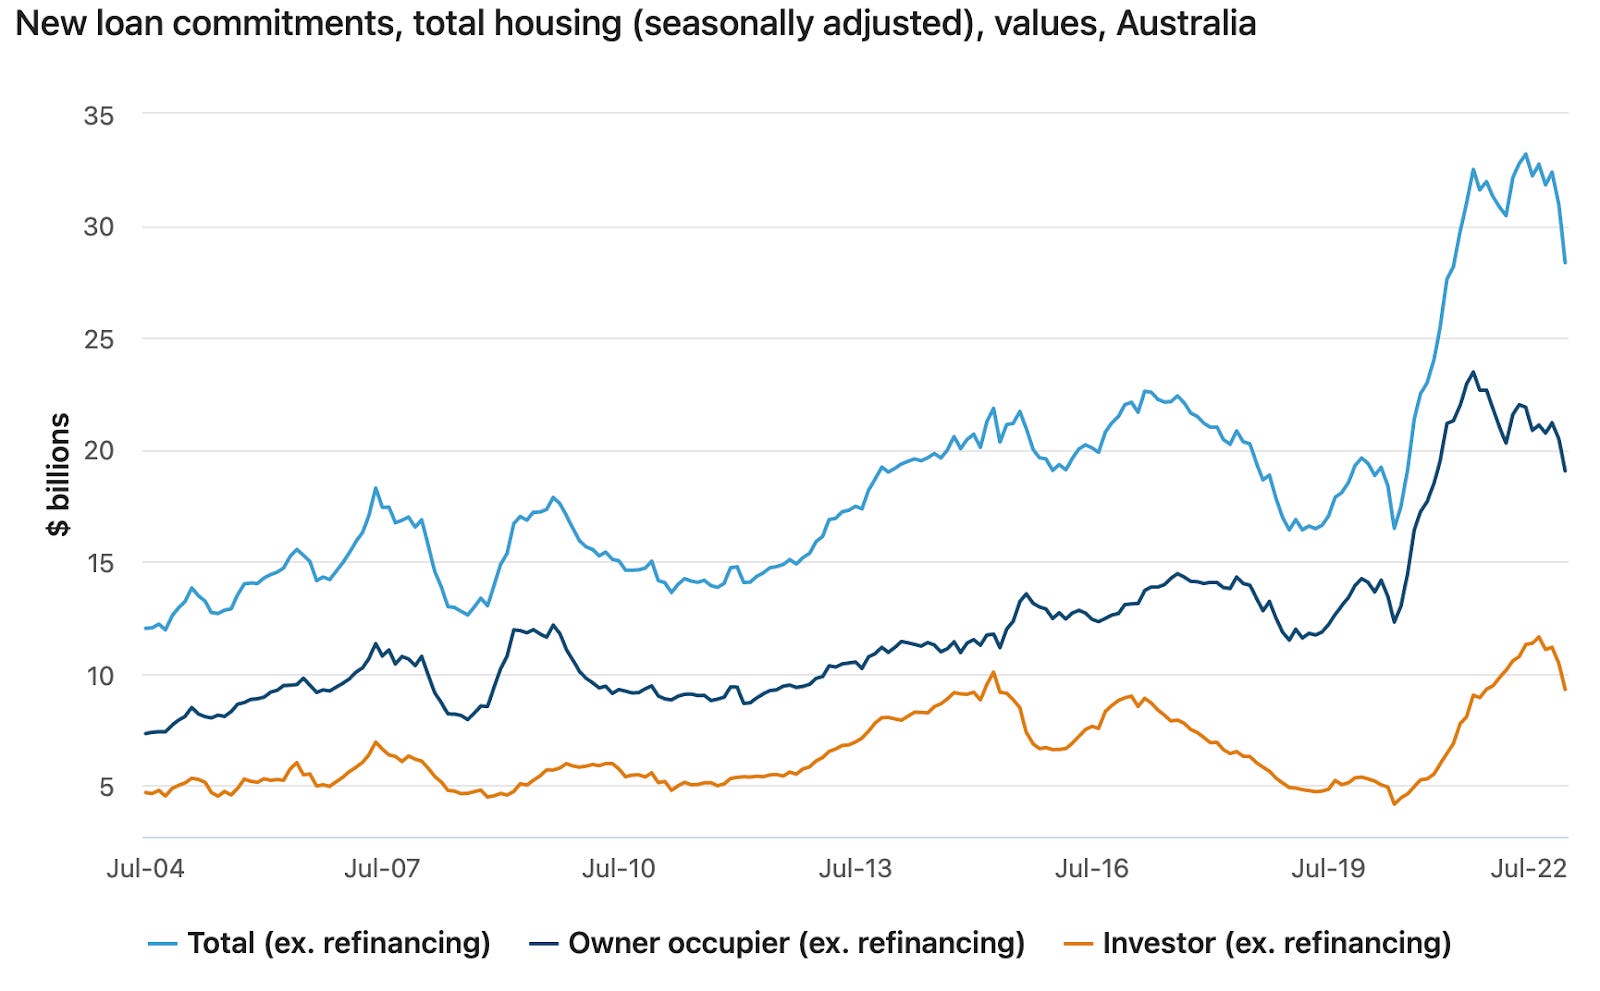
Earlier this week, we saw data showing that housing credit had fallen 8.5%, which tells us that more house price falls are coming.
We also noted that credit is still running relatively strongly in dollar terms, which tells us the worst is yet to come.
If we start to see credit slow further, we expect price falls to accelerate… this is our primary “leading indicator”.
The chart to watch is the one below:
Long-Term Fixed Rate Movement
Tom’s second point is in response to recent moves by the major banks to reduce fixed rate mortgage interest rates.
Tom claims, "If the bank drops long-term fixed rates, this will send a message to buyers that rates will probably stop going up next year and potentially go down once inflation has been addressed”.
We understand where Tom is coming from.
If a bank is willing to lend at a lower rate over a fixed term, then surely they know something we don't.
But let's remember these were the same banks offering fixed rate loans over 3-4 years with interest rates of 1.8% only a few months ago.
So maybe they don't know as much as Tom is giving them credit for…
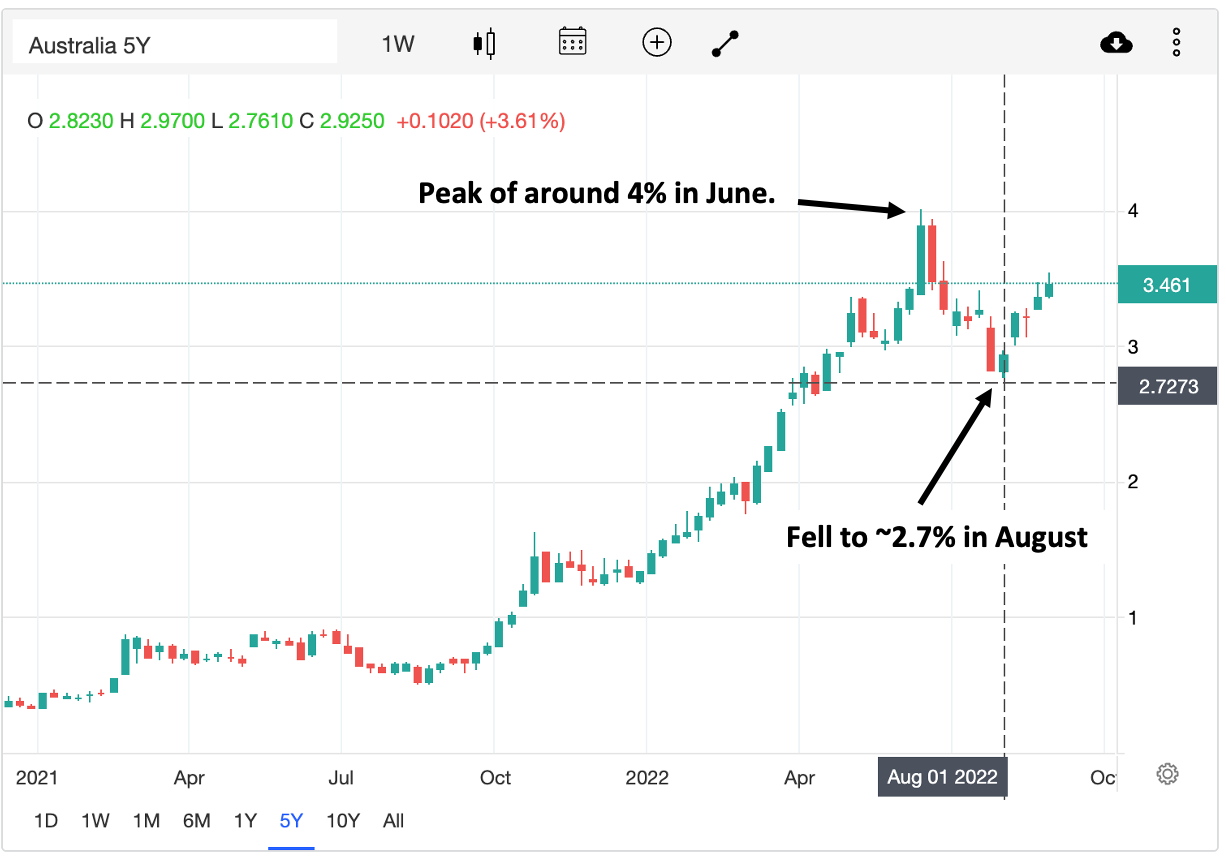
The reality is that the fixed-term mortgage rates are highly correlated with the 5-year government bond yield, meaning changes in the yield impact the interest rate a major bank is willing to offer on fixed-term loans.
(We touched on this relationship in a previous article which you can read here: Bonds & the property market)
At a very high level, if the bond yield falls, then fixed-rate mortgage rates also fall. If they move higher, then fixed-rate mortgages follow them higher.
As you can see, the recent drop in rates from the big banks was just the banks reflecting a decrease in bond yields from the June highs.
Unfortunately for Tom and everyone else speculating in Real Estate, the yield on the government bond yield has started to tick back towards the June high.
Distressed Vendor Selling
Tom’s third point is that distressed sales that lead to prices falling.
He explains the cycle of NEEDING to sell leading to discounts which then sets a lower reference point for new listings.
He then states that “so far this year there has been no evidence of distressed selling, with very little unemployment” and that “This should continue through to spring, so when a vendor does not need to sell, they won’t”.
This is where we again disagree with Tom.
Interest rates on mortgages have gone from ~1.8-2% to now sit around the 4-4.5% range, as rates continue rising, interest rates are expected to go to ~5-6%.
For someone with a $600,000 mortgage, a 4% mortgage rate is very different to a 6% mortgage rate.
In fact, for someone paying interest only, this would be an increase of almost 50% in repayments ($1,000/month).
Someone might be willing to finance this for one, two or three months, but the long-term solution is to sell and repay the debt.
As time passes, the NEED to sell will become stronger even if the person is employed.
With everyday living costs increasing, the last thing consumers can afford is their interest repayments to increase.
This adds strength to our theory that it takes at least 6-9 months for the true impacts of rate rises to be felt and for people to start changing how they live to re-adjust their finances.
As time passes, we think distressed selling will worsen and that we haven't seen any of it yet because the 6-9 month minimum time after cash rate rises has not happened yet.
We think the distressed selling starts towards the back end of this year and runs through 2023 if the RBA does what it says it will and continues to increase rates.
Supply of New Listings
Here Tom comments on a lack of listings compared to other spring seasons where agents are used to seeing a flurry of stock from those vendors who decided to hold off during the winter months.
Here Tom thinks, “Many vendors this spring may choose to not come to the market because they feel like they can’t achieve their price.”
He believes that “if there is less stock, then prices falls will be fewer and less severe”.
Again Tom seems to be speaking based on anecdotal evidence here, and if he believes there will be no distressed selling, there might be a case for his argument.
Our view is very different…
We think that as rates continue to rise and reach levels most people (including Tom) thought would not be possible, forced selling will increase as highly leveraged property owners look to reduce their debt burdens.
Especially those with investment properties that will go from paying out cash to its owners to now requiring the owner (investor) to pay because the costs of paying down the loan have gone to levels not seen for a very long time.
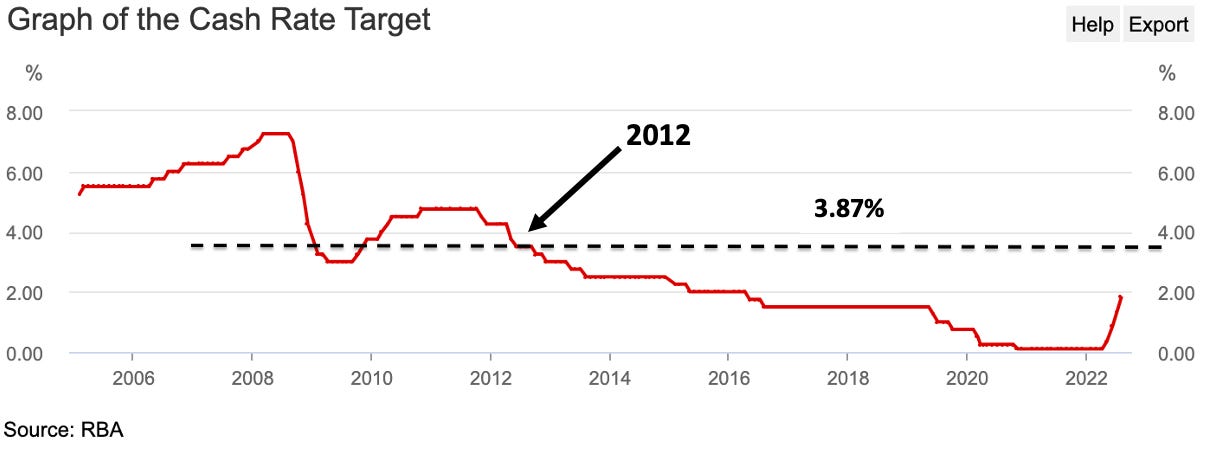
As mentioned earlier, the market thinks the cash rate will peak at around 3.87% in July 2023.
If it gets to those levels, we will be in completely unchartered waters for most property speculators.
Levels not seen since 2012, when the average house price in Sydney was ~$660,000 - almost 58% lower than the current average home price of ~$1,600,000.
Here is the RBA cash rate chart illustrating our point.
Our closing thoughts💭
So Tom thinks “that we are very close to the end of the correction”.
We disagree and think that there is a lot more pain to come.
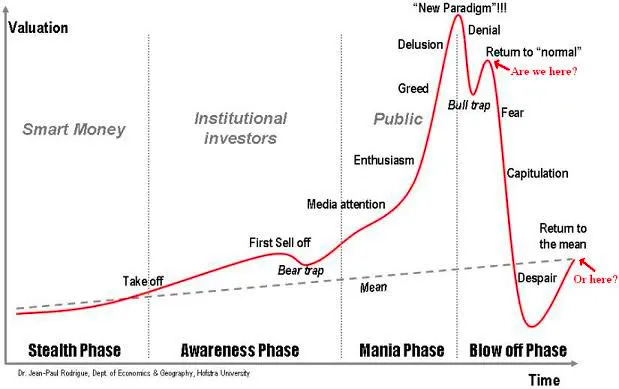
He then uses the clock analogy, explaining how the 12 to signal the top of the market and the six at the bottom. He thinks we are at “a five” and that the end is close.
We disagree and would put the clock at BEST at about a three.
Tom may need to look at the image below and re-assess his thesis.
Property dashboard:
For those who are reading this blog for the first time, we just released a property dashboard where we put together a wrap-up of everything property across the NSW/VIC markets.
In our dashboard, you can find the following:
Our property data wrap for the week
The feature article for the week
The chart of the week
Subscribe to get the email in your inbox every week.
To read our latest dashboard, click here.