

Your weekly property newsletter
Your weekly property newsletter
Everything you need to know

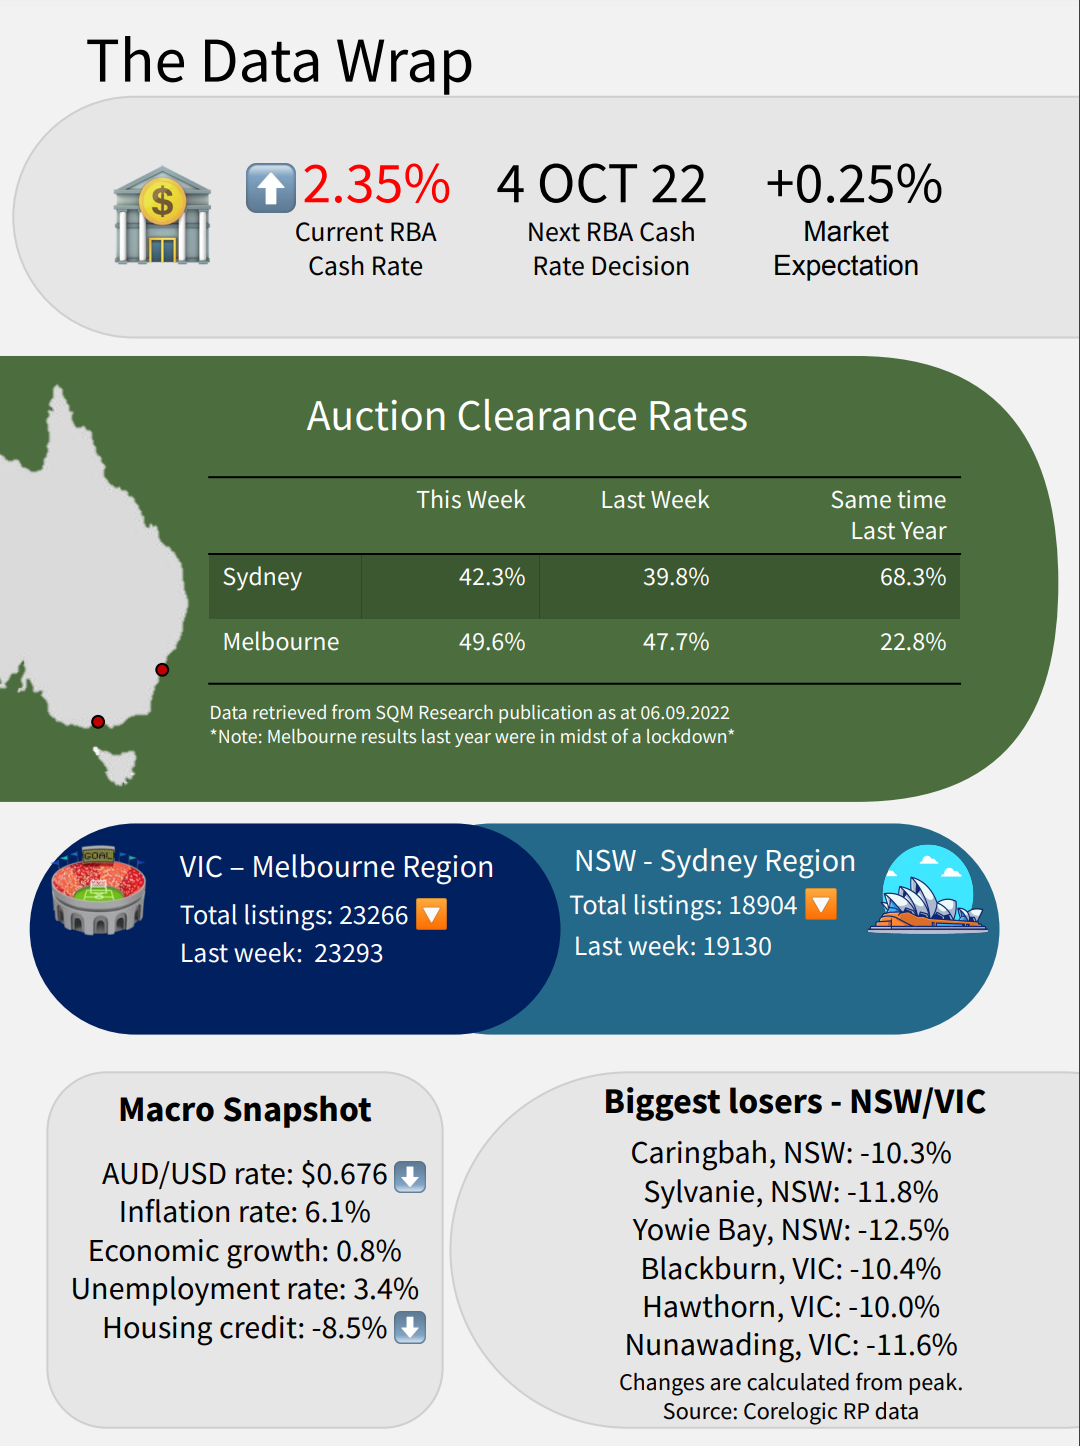
Property Dashboard - 7th September 2022

The feature article of the week:
Below is our feature article for this week’s edition of the newsletter.
This is the article we found most interesting to read and the one we think is a “must read” for all our readers.

Key takeaways:
New loans for housing fell in their second fastest rate in the past two decades.
Lending fell 8.5% in July, after falling 4.5% in June.
New loan commitments to first home buyers also fell 35.9% versus last year.
The drop in lending marks the biggest month-on-month decline on record, outside of the covid-induced decline in May 2020.
Our Take:
This article speaks to a correlation we have written about previously in one of our very first articles. (What happened in 2021, stays in 2021)
That is the connection between credit growth and property prices.
The typical property in Australia is purchased using 80% debt financing, and 20% equity. Inherently, this means that purchasing power of a homebuyer is highly dependant on access to credit.
Evidenced by the chart below, period where lending is falling or stagnant usually tend to lead to price falls - the most recent example being the period between 2019 and 2020 where property prices across Sydney and Melbourne fell between 10-12%.
This connection works both ways, if lending is increasing then prices tend to follow higher aswell.
The most recent example of this is the ~25% run up in property prices which was accompanied by record lending for housing between 2020 and 2021.

Our view is that credit growth for housing is the single biggest indicator for where property prices are headed.
With the RBA raising the cash rate at the fastest pace since the 1990’s, we expect to see credit growth fall off a cliff over the coming months which we expect will lead to even further price declines in Sydney and Melbourne property prices.
Watch this space.
We will be monitoring this data over the coming months and highly recommend all of our readers do too. The data should be available in the first week of October at the following link: https://www.abs.gov.au/statistics/economy/finance/lending-indicators)
Other Mainstream media 📰
As rates rise, housing markets show no sign of distress (AFR)
Slow start to spring as one in four Sydney vendors pull listings (AFR)
Down $325k: 20 regional suburbs seeing the biggest property price falls (Yahoo finance)
Queensland tax ‘grab’ will reduce house prices and increase rents (AFR)
Tiffany bought her first home but didn’t expect the mortgage to go up so soon (The Age)


Why should you care:
The RBA cash rate is the key determinant of mortgage interest rates.
The higher the cash rate goes, the more expensive a mortgage becomes and vice versa.
Increases/decreases in the cash rate also impact demand for new credit.
Higher borrowing costs and reduced demand impact property property prices negatively.
Our takeaway:
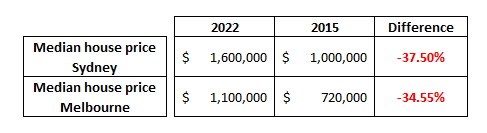
The cash rate is now higher than where it was in February 2015.
In 2015 median house prices in Sydney were 37.5% lower than they were at the start of 2022 and in Melbourne were ~34.55%.
Our expectation:
At present CoreLogic data suggests that Sydney home prices on aggregate are down ~7.4% from the peak and in Melbourne down 4.3%.
Despite the media narrative suggesting the worst of the price corrections are done and that it is time to start buying, we think the fundamentals are getting worse with every rate cut.
Our expectation is not to see prices fall to levels seen in 2015 but we would be comfortable betting on prices continuing to fall from here.