


Property investing hall of shame Pt.1
Governor Lowe solemnly swears he is up to no good

Property hall of shame with a side of rate hikes.
What’s on our mind: RBA increased the cash rate to 1.85%. Property investing “Hall of shame” and an update on mortgage interest rates.
What happened this week: RBA increased the cash rate by 0.5% to 1.85%, and Housing credit fell 4.4% in May.
What are we watching next week: Westpac consumer sentiment data, US inflation data, UK economic growth data.
Prelude:

What’s on our mind:
The RBA set the tone for this week's article by increasing the cash rate by 0.5% to 1.85%.
The last time the cash rate was this high was in April 2016… >6 years ago.
With the market expecting another 0.5% hike in September, the market is very quickly moving into completely un-chartered territory.
For some context, another 0.5% hike would take the cash rate to levels last seen in Dec-2014.
The following two facts set the scene for just how different things looked back then:
In December 2014, the median house price in Sydney was $873,786.
At the end of 2021, the median house price in Sydney was $1,601,467.
So after the September rate hike, the cash rate will be HIGHER than when the median house price in Sydney was ~50% lower.
With that in mind, today we are starting a new series we will feature in future articles.
We are calling it the:
“Hall of Shame” - Comparing sales of similar/identical properties in 2021 to now and putting some financial context behind them.
With CoreLogic data currently showing Sydney prices down 5.3%, and Melbourne prices down 3.4%, we will look at recent sales and see how the numbers stack up on the ground...
Our house view is that the financial outcome for property owners is much worse than the data is reporting (and we are being generous with our assumptions).
This week’s “Hall of Shame”:
The purpose of this isn't to parade poor outcomes for vendors. It is more so to try and paint a more wholistic picture for readers.
It’s easy for a spruiker to say that the price of a property hasn't moved that much, but that doesn't take into account interest costs, stamp duties, costs of ownership, maintenance or agent fees.
Even if the price hasn't moved nominally, the financial outcomes for “investors” may be a lot worse than things look on paper…
That being said, even on paper, the numbers can sometimes look grim.
We expect this list to become much more exhaustive over the coming months, so be on the lookout for an update every few weeks.

Address: 10 Ashburner Street, Manly NSW, 2095
Recent sale: $3,600,600 - May 2022
Previous sale price: $4,215,000 - December 2021
The vendor here lost ~15% on this property, and that is before accounting for any transaction costs.
If we add in the stamp duty paid on purchase and the agent fees paid on the sale, the loss quickly climbs to >20%.

Address: 51 Bix Road, Dee Why NSW, 2099
Recent sale: $2,376,000 - March 2022
Previous sale price: $2,395,000 - December 2021
A modest nominal loss here, but once we consider agents' fees and stamp duties, the losses on this are nearing 5-7%.
Worst of all, this was sold in March-2022… before rates had started moving.

Address: 56 Price Street, Essendon VIC, 3040
Recent sale: $1,850,000 - July 2022
Previous sale price: $1,918,000 - March 2021
Another modest loss nominally, but this property sits in a “blue chip” suburb in the inner north of Melbourne.
After stamp duties and agent fees are considered, the loss here is already >7% (NOT including interest).
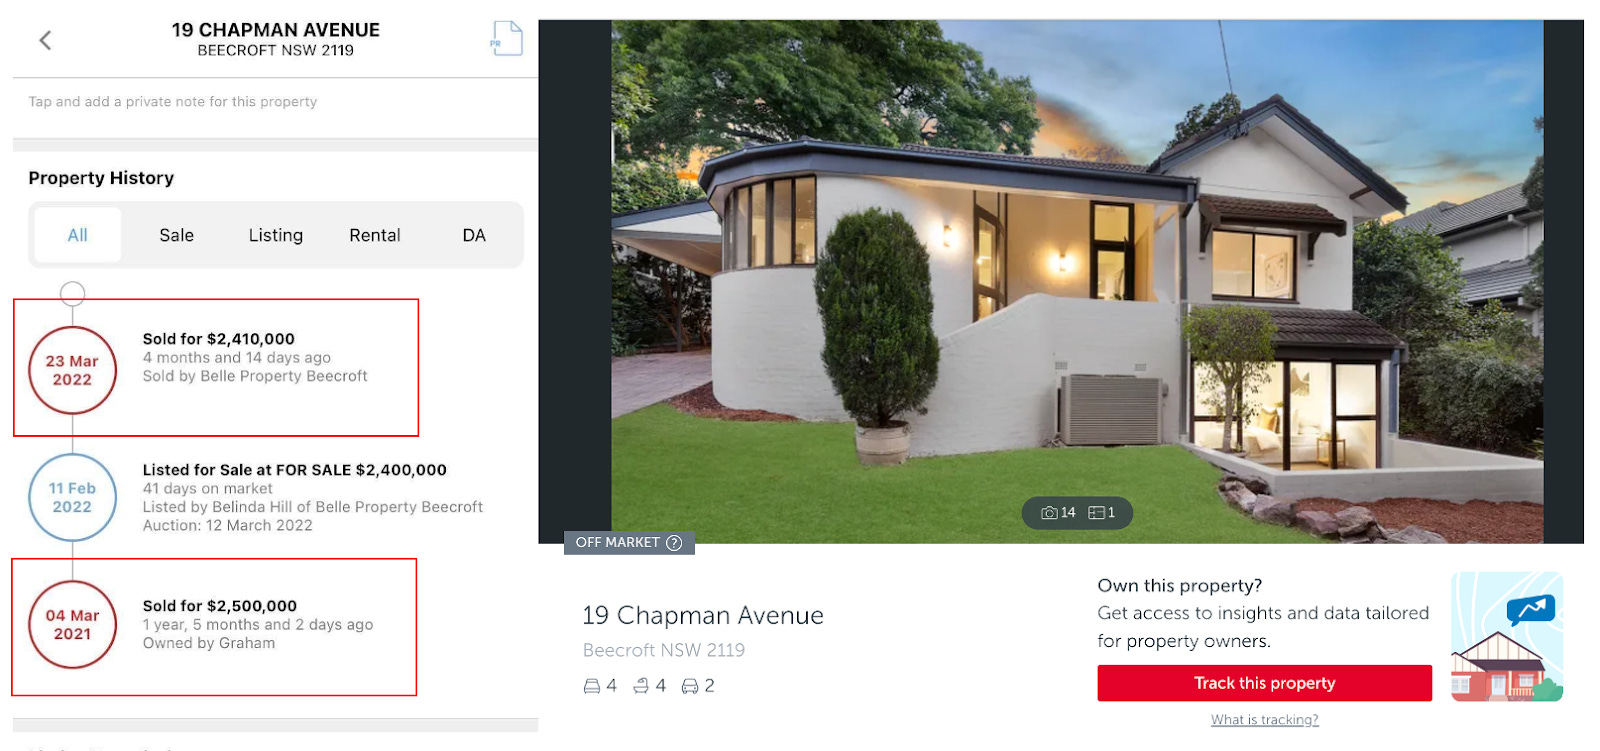
Address: 19 Chapman Avenue, Beecroft NSW, 2119
Recent sale: $2,410,000 - March 2022
Previous sale price: $2,500,000 - March 2021
A modest ~4% drop in the purchase price from 12 months ago.
BUT
Once we account for agents' fees on the sale and stamp duties on the purchase, the vendor is out of pocket >10%.
This is without considering all the interest the vendor would have paid over those 12 months.

Address: 48 Brees Road, Keilor East VIC 3033
Recent sale: $920,000 - May 2022
Previous sale price: $920,000 - November 2021
Here the vendor would have paid $51,000 in stamp duties when purchasing, spent ~$30,000 on plans and permits and then had to pay the agent another ~$20,000 to sell the property.
An estimated ~$100k (11%) loss on this “investment”.
All of this without even taking into account interest repayments.
Summary:
It's looking nasty out there, and the music has well and truly been turned off at the Australian property market party.
In fact, it reminds us of this scene from a movie called “Margin Call” which looks at the sub-prime mortgage (housing) crisis in the US in 2008:
Mortgage rates - Update
In a previous article, we did a deep dive on how banks determine mortgage interest rates.
(To read that article, click the following link: How do mortgage rates rise)
With the cash rate changed, we updated our bank funding costs spreadsheet to try and estimate where mortgage rates sit in the current environment.
The formula we put together was as follows:
(1) Funding costs 2.65% +
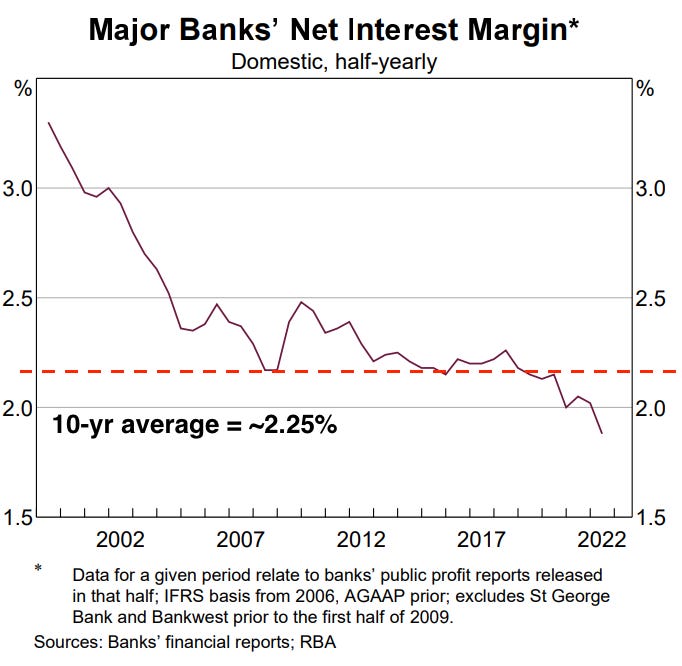
(2) Net interest margin 2.25% =
(3) Mortgage rate offered to new borrowers is 4.9%.
1. To work out funding costs, we used the following:

2. We used a ~10-year average of 2.25% to work out the net interest margin.
3. We then add the two together to calculate mortgage rates and get 4.9%.
An almost doubling of the mortgage rates being offered in 2021, which we think will, over the next few months, impact property prices.
Watch this space.
Interested to know if the bank recalculates the LVR and what happens when the lvr is above the banks threshold
I've been watching out for the word "bubble" in the media but haven't seen it yet. Still early days