Which suburbs are being hit the hardest?
Which suburbs are being hit the hardest?
Suburbs with the biggest losses across NSW/VIC

Property prices falling - but by how much?
What’s on our mind: Which suburbs are feeling the heat the most across NSW/VIC? Today we list discounts where prices have been smashed the hardest.
What happened this week: New Zealand central bank increased its cash rate to 3%.
What are we watching next week: US Fed chair Jerome Powell speech, US economic growth numbers.
Prelude:

What’s on our mind:
This week's major bit of news came from our neighbours across the Tasman sea - New Zealand.
The NZ central bank increased the cash rate to 3% - the highest level since 2015.
The context to all of this:
Average house prices in Auckland in 2015 = $920,000.
Average house prices in Auckland in 2021 = $1,300,000.
Price falls to 2015 levels would see a decline from the 2021 peak of ~41%.
Where is NZ now?
Right now, Auckland prices are down ~14% from the peak.
If we are to see prices go back to levels based on the cash rate, there is still a potential ~27% downside.
How about the RBA?
With that in mind, we turn our focus to the RBA.
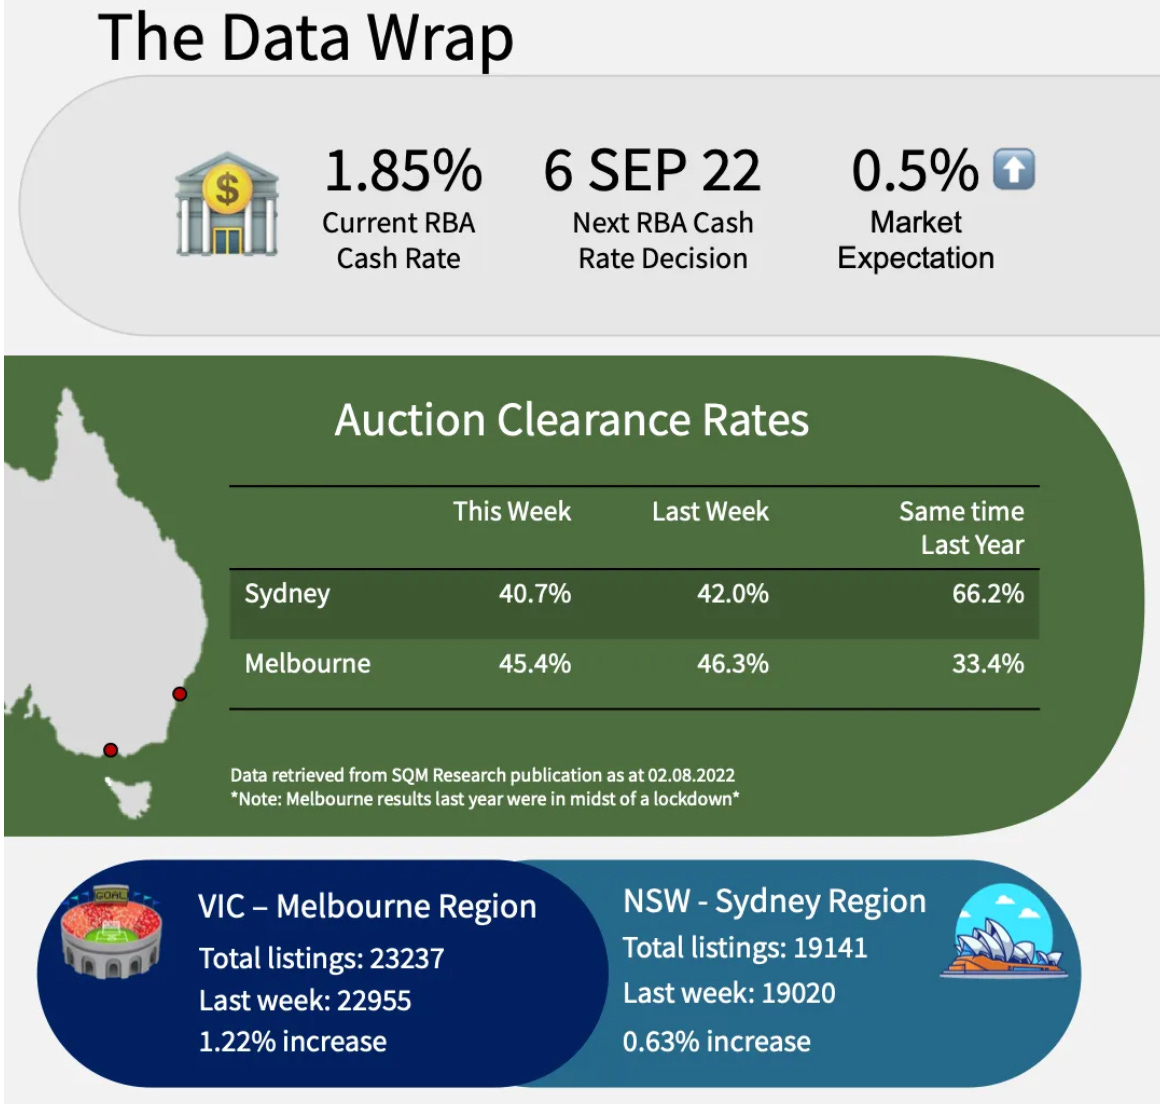
The cash rate currently sits at 1.85% - a level not seen since 2016.
After the expected 0.5% increase in September, the cash rate will sit at a level not seen since 2015.
The context to all of this:
Average house prices in Sydney in 2015 = $1,219,000
Average house prices in Sydney in 2021 = ~$1,600,000
Price falls to 2015 levels would see a decline from the 2021 peak of ~24%.
The point of all of this?
Everything is relative.
Here in Australia, our cash rate may be relatively lower, but that doesn't mean our cash rate is at a level where it should start to have an impact on prices yet.
I.e. the natural way to think about it would be “until we are at 3% similar to New Zealand, the market won't react”.
The reality couldn't be further from that.
Today, we pinpoint some of the worst-performing suburbs across NSW and VIC, highlighting how much prices have been impacted.
Corelogic data is currently telling us:
Sydney prices are down ~6.1% from the peak.
Melbourne prices are down ~4.1% from the peak.
Our analysis shows that the price falls are much higher in the 10-20% range across the most densely populated suburbs.
One thing that may surprise folks is that these are the suburbs that every property investor/spruiker would consider “blue-chip” and “premium”.
The suburbs, these people were on record saying, would never be impacted by price falls.
So what are these suburbs?
Biggest losers - Sydney and Melbourne:
Here they are across Sydney and Melbourne, where some suburbs are down up to 20% from the peak.
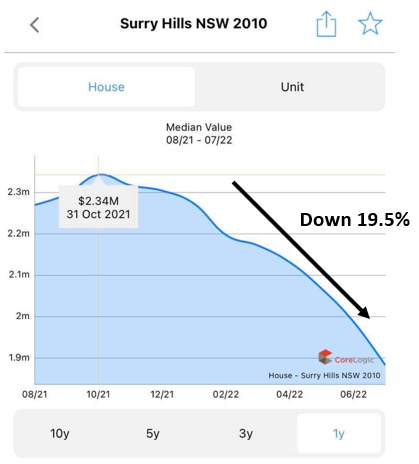
Suburb: Surry Hills, NSW, 2010
Peak median value: $2.34m
Median Value July 2022: $1.88m
Price falls from peak: Down 19.5% 📉
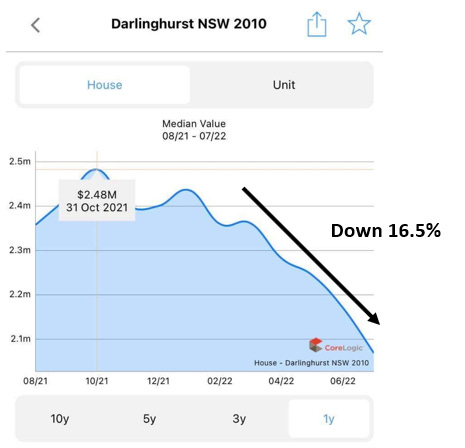
Suburb: Darlinghurst, NSW, 2010
Peak median value: $2.48m
Median Value July 2022: $2.05m
Price falls from peak: Down 16.5% 📉
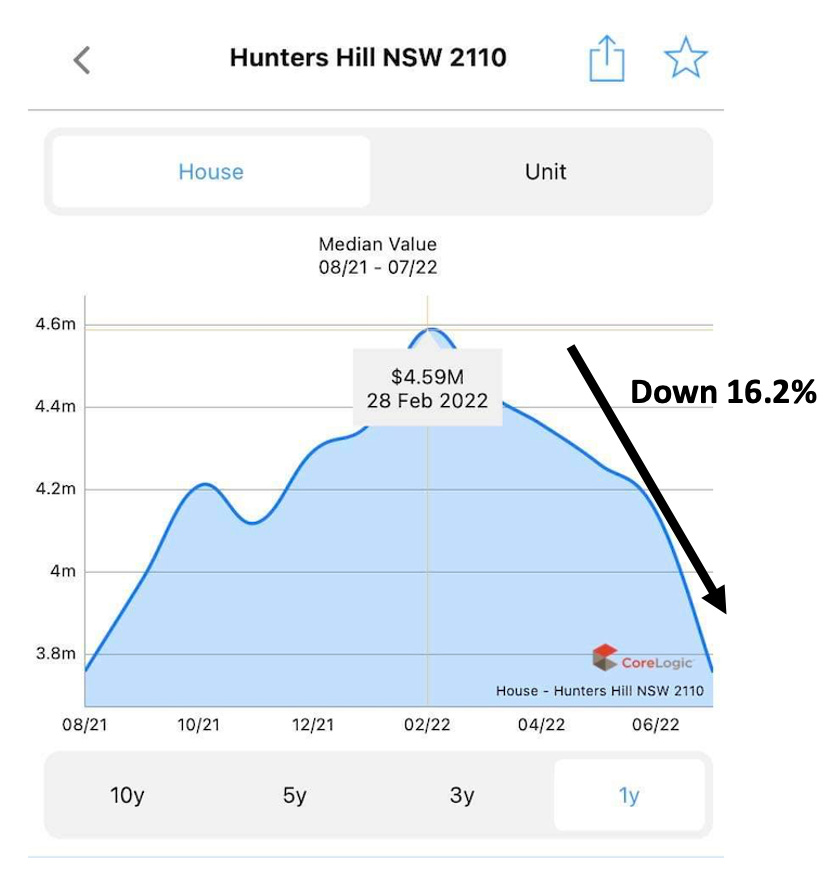
Suburb: Hunters Hill, NSW, 2110
Peak median value: $4.59m
Median Value July 2022: $3.85m
Price falls from peak: Down 16.2% 📉
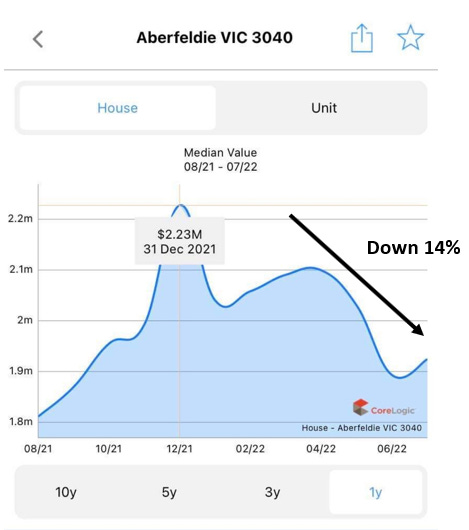
Suburb: Aberfeldie, VIC, 3040
Peak median value: $2.23m
Median Value July 2022: $1.9m
Price falls from peak: Down 14% 📉

Suburb: Balaclava, VIC, 3183
Peak median value: $1.7m
Median Value July 2022: $1.55m
Price falls from peak: Down 11% 📉
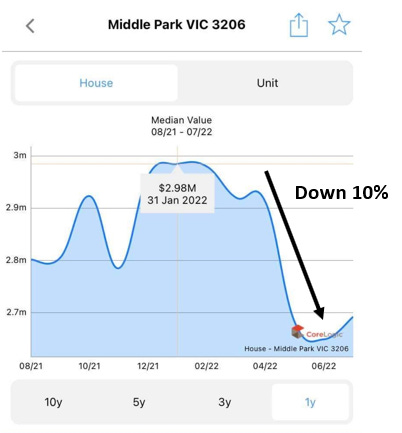
Suburb: Middle Park, VIC, 3206
Peak median value: $2.98m
Median Value July 2022: $2.7m
Price falls from peak: Down 10%📉

Suburb: Park Orchards, VIC, 3114
Peak median value: $2.23m
Median Value July 2022: $1.8m
Price falls from peak: Down 18.5%📉
Property dashboard:
For those who are reading this blog for the first time, we just released a property dashboard where we put together a wrap-up of everything property across the NSW/VIC markets.
In our dashboard, you can find the following:
Our property data wrap for the week.
The feature article for the week
The chart of the week
Subscribe to get the email in your inbox every Tuesday/Wednesday evening.
To read our latest dashboard, click on the image below.