

Travelling back in time
Travelling back in time
trying to predict the future

Cash rate at 2012 levels - How about house prices?
What’s on our mind: Reading between the lines of the RBA policy decision and some quick-fire ratio analysis.
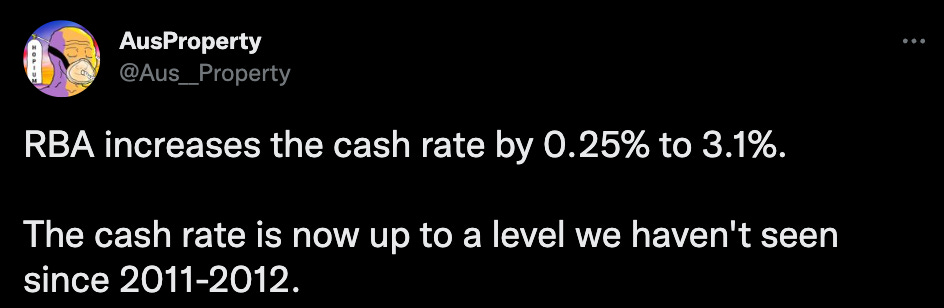
What happened this week: RBA increased the cash rate by 0.25% to a 10-year high of 3.1%.
What we are watching next week: Australian unemployment data, US inflation data, UK inflation data, and European rates decision.
Prelude:
What’s on our mind:
It's hard to write a newsletter this week and not talk about Tuesday’s cash rate increase from the RBA.
The RBA’s decision came as a bit of a surprise for markets hoping the central bank would pause for December.
Instead, the RBA decided to press on with its eighth rate hike of the year - a hike of 0.25%.
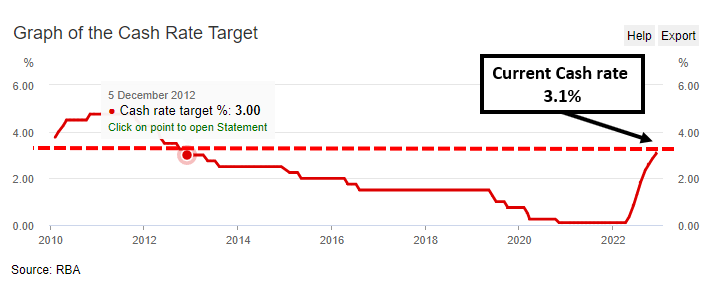
With that, the RBA took the cash rate to a level not seen since 2012 at 3.1%.
We covered that news in a tweet earlier in the week which you can see on our Twitter page here:
For context (in visual format), the cash rate chart below shows the last time rates were this high.
Naturally, this got us asking one particular question.
How much were we paying for housing in Sydney and Melbourne the last time the cash rate was this high?
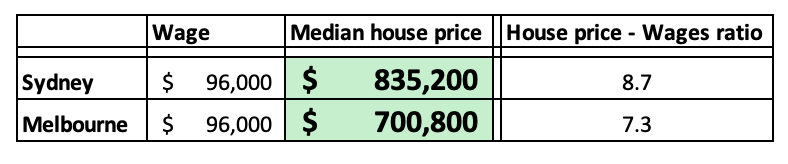
To try and find an answer, we focused on the following set of data from 2012:
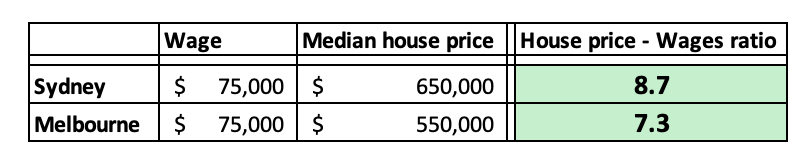
Average full-time wage across Australia - ~$75,000
Median house price in Sydney - ~$650,000
Median house price in Melbourne - ~$535,000
Using that data, we got the following House Price - Wages ratio:
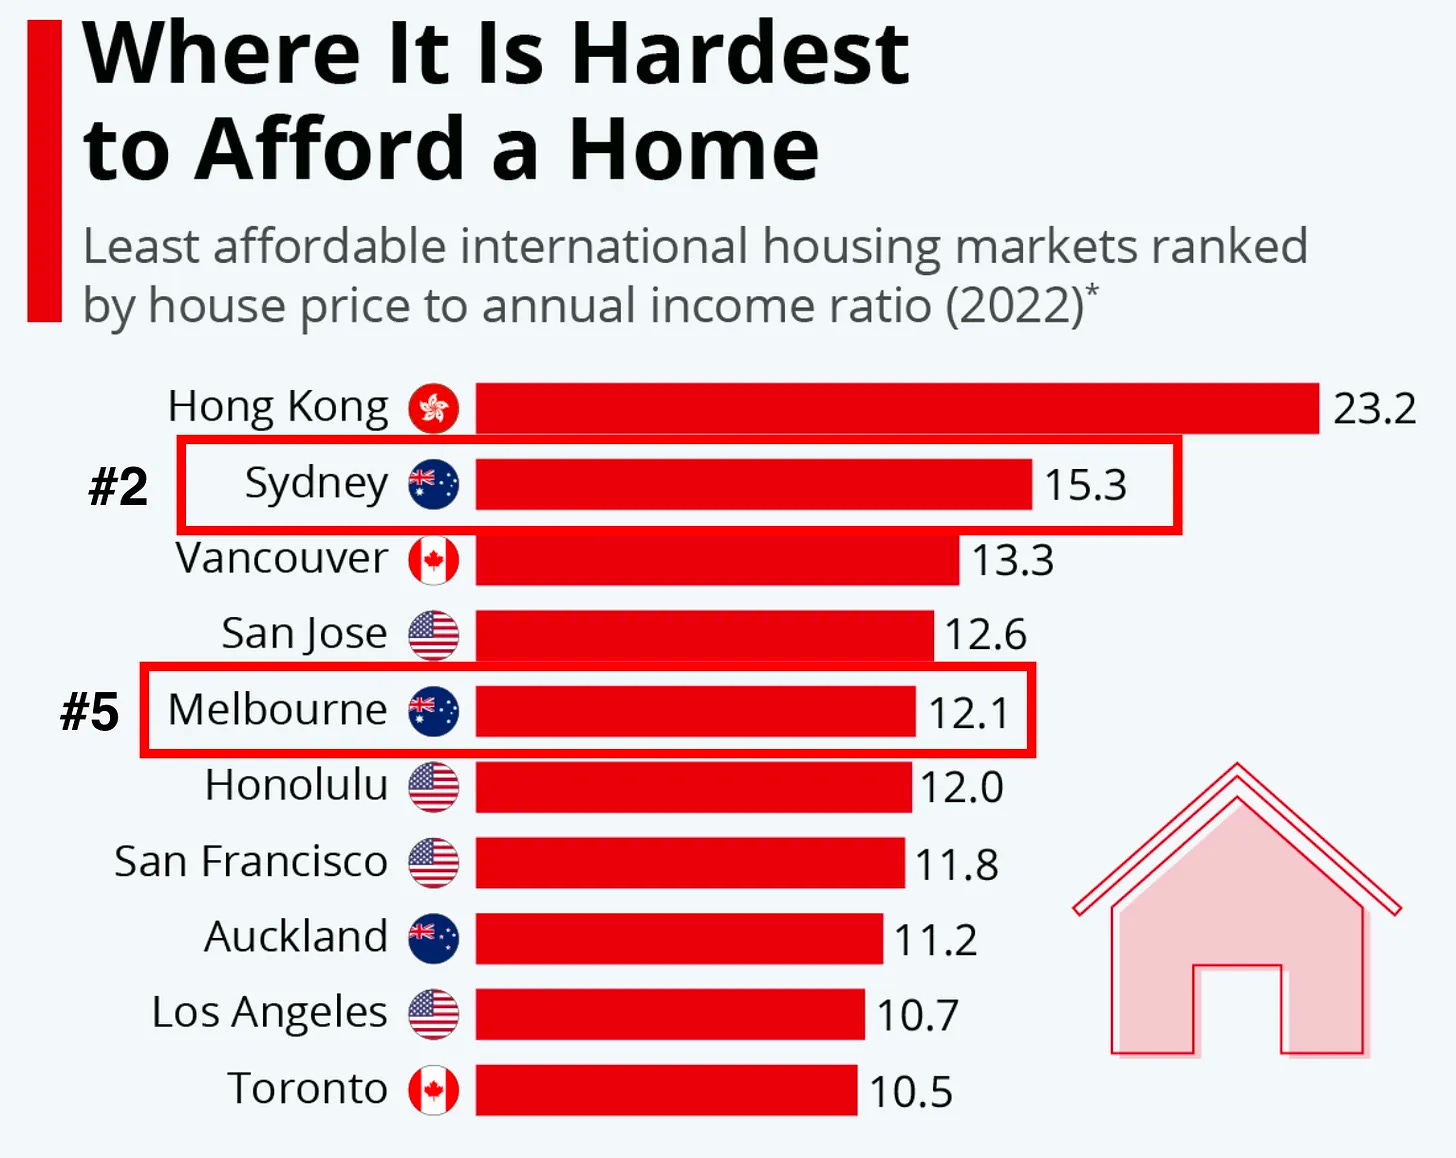
We did this to see how much Australians were paying for housing in Sydney and Melbourne the last time the cash rate was this high (at 3% or higher).
After all, when rates hit record lows of 0.1%, the median property price in Sydney hit ~16x the average income and in Melbourne ~13x.
This ranked Sydney Sydney as the 2nd most expensive property market in the world, with Melbourne coming in at 5th.
How would Sydney and Melbourne's prices look if we applied the ratios from 2012 to Australia's current average wage figures?
Applying the 8.7x and 7.3x multiples, we got median house price figures as follows:
For some context, the median house prices for both these cities are as follows - we also show how overvalued it is relative to the 8.7x and 7.3x multiples:
Sydney ($1,243,126) - 33% overvalued using the ratios from 2012.
Melbourne ($915,005) - 23% overvalued using the ratios from 2012.
We are conscious of incomes in Sydney being much higher than in Melbourne, so there is an argument to be made for that ~10% variance in valuation.
Nonetheless, looking at these ratios alone, it would be fair to assume that there is still at least room for ~20% further falls in house prices across both states.
Keep in mind this doesn't include any future rate rises… which brings us neatly to the next thing plaguing our mind this week.
Reading between the lines of the RBA’s monetary policy statement:
Making a forward-looking statement HIGHLY conditional on “the data” is something the RBA governor Phil Lowe has done before.
The last time he did it was in 2020 when he said rates wouldn't rise materially until at least 2024 (contingent on …..).
Two years later, we now sit here with a cash rate of 3.1%.
So what did the RBA say this week?
On the RBA’s inflation forecasts:
Here the RBA is saying the inflation problem will get worse before it gets better.
Immediately the RBA caveats that with expectations for inflation to fall in 2023.
More importantly, the RBA expects inflation to fall to “a little above 3% over 2024”.
In plain English, this tells us that the RBA sees medium-term inflation to hover around where the RBA’s cash rate is now - a first sign that we may be close to a peak in the cash rate.
On the cash rate and the housing market:
Then the RBA goes and drops the following bars:

First, the RBA is saying that the impact of the cash rate hikes havent been felt in the economy or in the housing market YET.
This underwrites our theory that we still have more pain to come in the housing market.
The RBA then says the path to “achieving a soft landing for the economy remains a narrow one”.
Is the RBA admitting they see a recession on the horizon?
What are the chances the RBA, who so incorrectly predicted rates wouldn't move until 2024, could land the economy softly if they themselves admit the path is a narrow one?
We think the chances are slim to none.
On the possibility of future cash rate hikes:

The RBA lets the market know to expect more rate hikes but caveats it by saying it isn't a pre-set course and that it will change if data starts looking bad.
The RBA then shirtfronts the Australian economy by saying it will do whatever is necessary to achieve its inflation target.
Interesting, considering the RBA, only a few paragraphs above said they think the data will get worse.
Also interesting is that the RBA said it CURRENTLY expects the inflation rate to revert to its target in 2024…
We think that come mid-2023, the RBA will start to change its tune massively. Watch this space.
Thanks for reading,
Aus_Prop team.
You also need to be aware that since 2012 roughly 200k migrants have come to Australia year on year which has put massive pressure on the demand for urban housing, so whatever figures we have from 2012 need to account for that when being compared to now.
You use national wage average against city specific house prices. Is there average wage data for just Sydney & Melbourne, or at least, NSW & VIC?