

Same home, same suburb

Investing ‘Hall Of Shame” Pt.3 & the latest lending data
What’s on our mind: The trend is not your friend in the lending data and the third edition of the real estate investing hall of shame.
What happened this week: Credit growth is down ~17.1% compared to last year.
What we are watching next week: RBA cash rate decision, Australian GDP numbers, and US unemployment figures.
Prelude:

What’s on our mind:
The big news for this week came out of the Australian Bureau of Statistics (ABS).
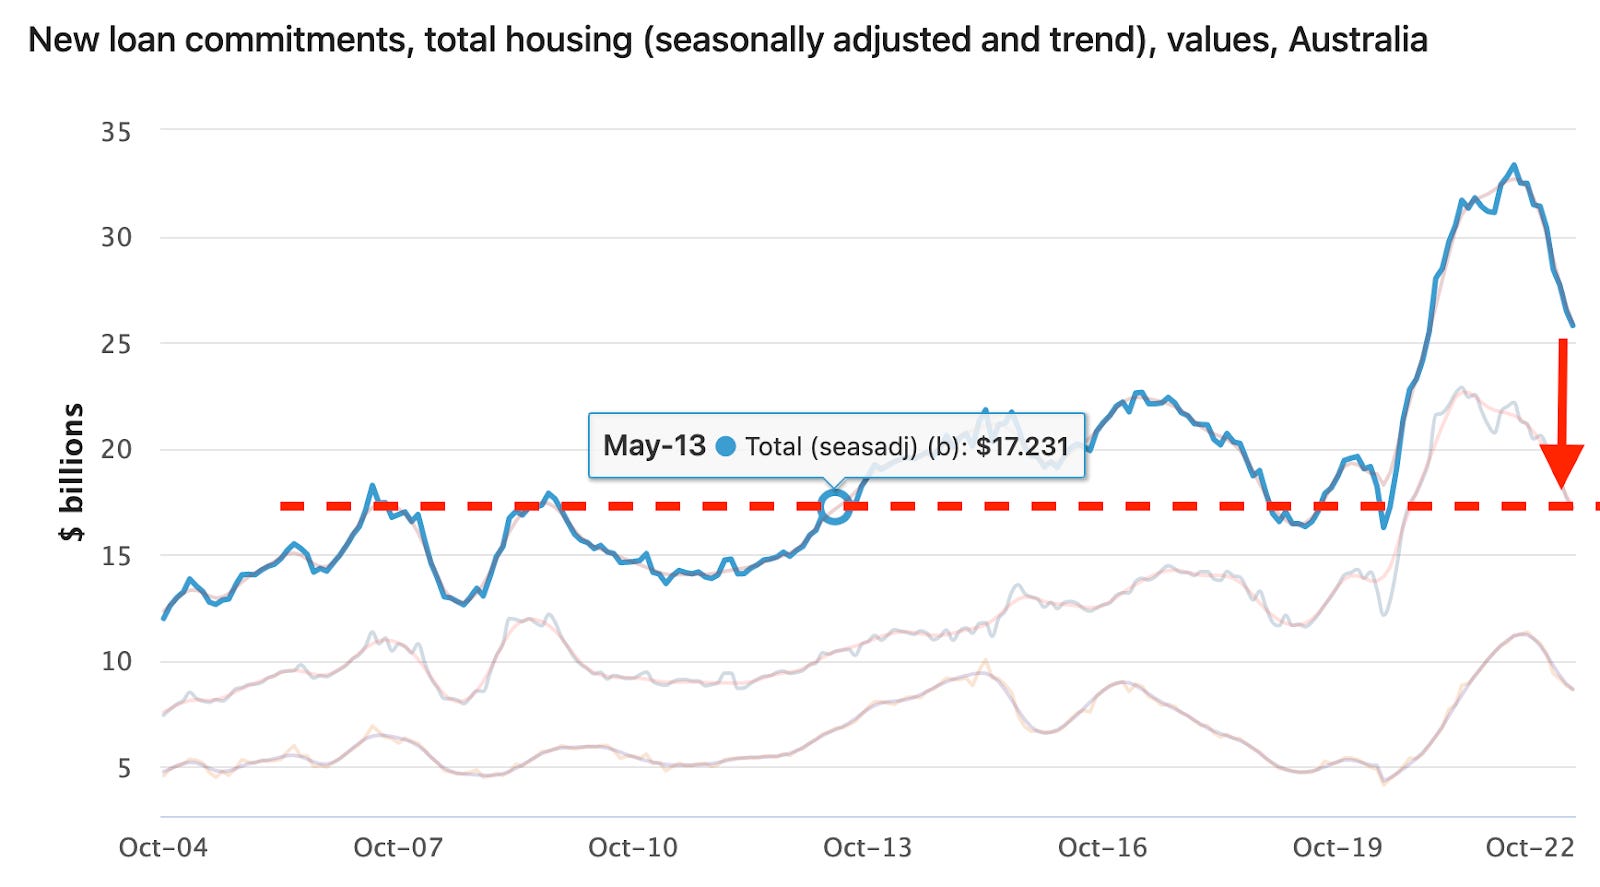
For the month of October 2022 total lending for housing was as follows:
Total lending for housing fell 2.7% to $25.8BN.
Owner-occupier lending fell 2.9% to $17.2BN.
Investor lending for housing fell 2.2% to $8.6BN.
The key takeaway is that total lending for housing fell 17.1% versus the same month last year (October 2021).
So why does all of this matter?
Our long-held view is that the biggest contributor to increasing or in this case decreasing property prices is the trend in credit growth.
At a very high level, whenever credit growth for housing is increasing, we expect property prices to rise - just like we saw in 2021 when credit was being made available at record levels.
Now with credit growth decreasing, we expect that property prices will continue to fall.
With interest rates now above May 2013 levels, we expect to see credit growth decrease to a level at least in line with that same time period where total lending for housing was ~$17BN.
This is our base case expectation, there is an argument to be made for credit to free fall to levels well below this but that is an article for another day.
For now the two charts that matter are below:
For some context, this would see credit growth decline to a rate in line with the ones seen in 2019 where prices started falling in the major market across Sydney and Melbourne.
With credit growth likely to decrease further from here, we maintain our viewpoint that the bottom for Sydney and Melbourne property prices is not in YET.
This week’s “Hall of Shame”:
The purpose of this isn't to parade poor outcomes for vendors. It is more so to try and paint a holistic picture for readers.
It’s easy for a spruiker to say that the price of a property hasn't moved that much, but that doesn't take into account interest costs, stamp duties, costs of ownership, maintenance or agent fees.
Even if the price hasn't moved nominally, the financial outcomes for “investors” may be a lot worse than things look on paper…
That being said, even on paper, the numbers can sometimes look grim.
We expect this list to become much more exhaustive over the coming months, so be on the lookout for future updates from us.
Special thanks to @rabbit_wealth where some of the following findings come from, if you like reading this section then you should follow him on twitter.
Address: 36 Montpellier Drive, Avondale Heights, VIC 3034
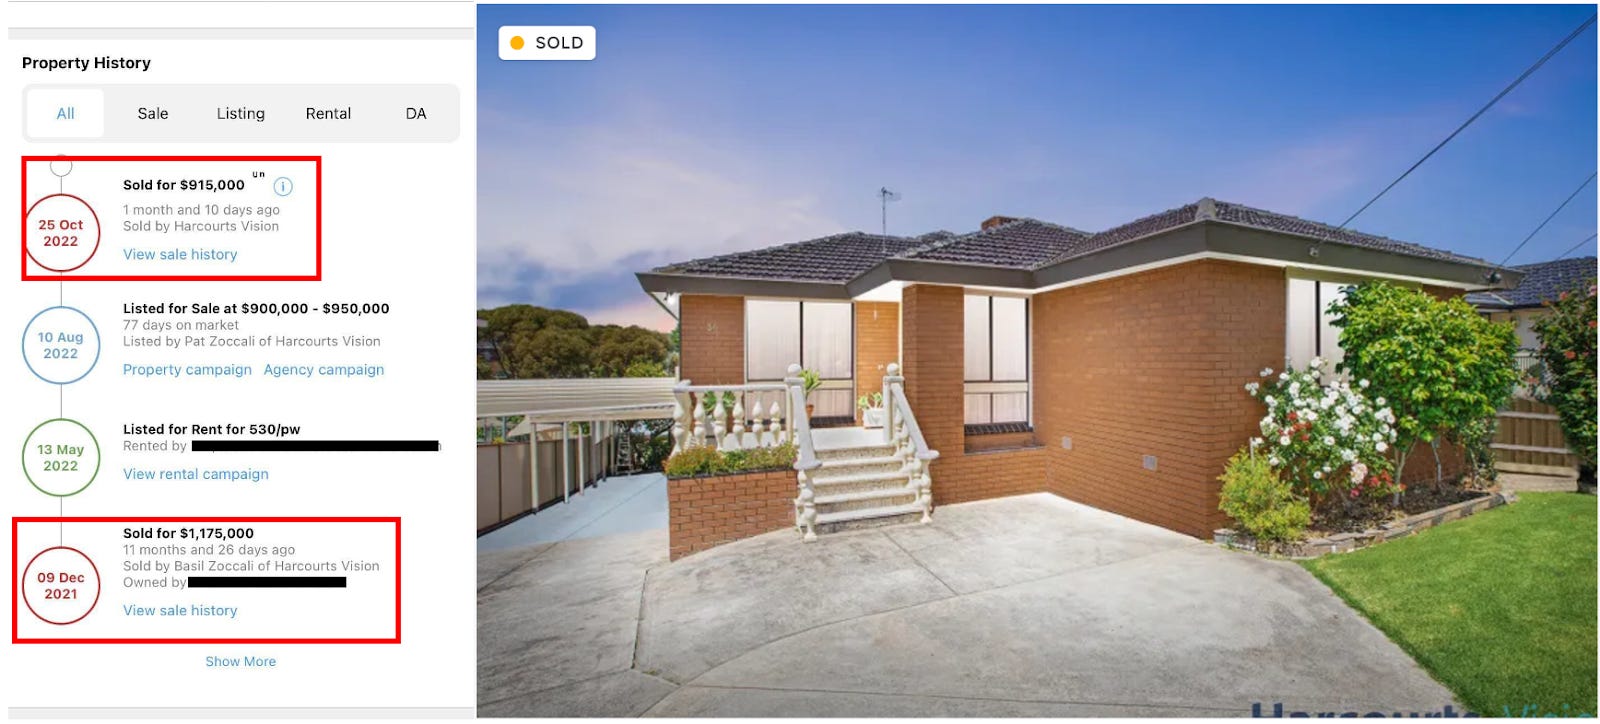
Recent sale: $915,000 - October 2022
Previous sale price: $1,175,000 - December 2021
After stamp duties and agents fees this is an almost ~30% loss for the vendor.
We havent even included interest costs in this calculation…
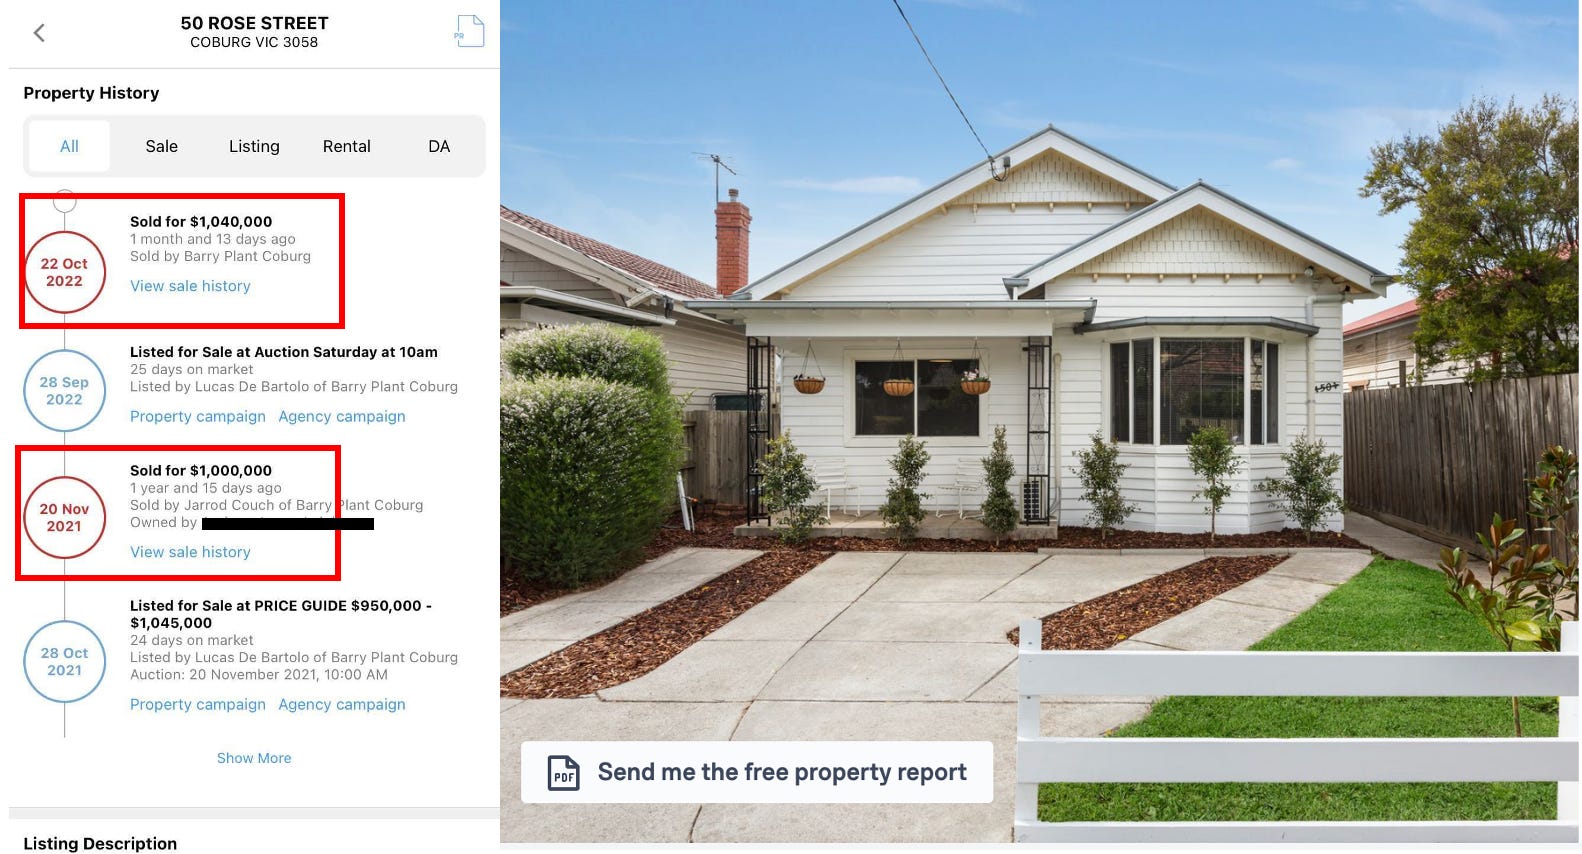
Address: 50 Rose Street, Coburg, VIC 3058
Recent sale: $1,040,000 - October 2022
Previous sale price: $1,000,000 - November 2021
This one is a warning for everyone who falls victim to the spruiking by ‘experts’ who encourage quick flips.
The purchaser bought the house in November 2021 and seems to have spent what looks like well over $40,000 to then only achieve a sale price $40,000 higher than what was paid 11 months earlier.
Here are some before and after pictures of the property:

A ‘profit’ that is not even enough to cover the stamp duties and agent fees paid on the property, let alone the costs of the major renovation works.
Worst of all… this is in a ‘blue chip suburb’ where agents and spruikers will tell you the opportunity to make money is.
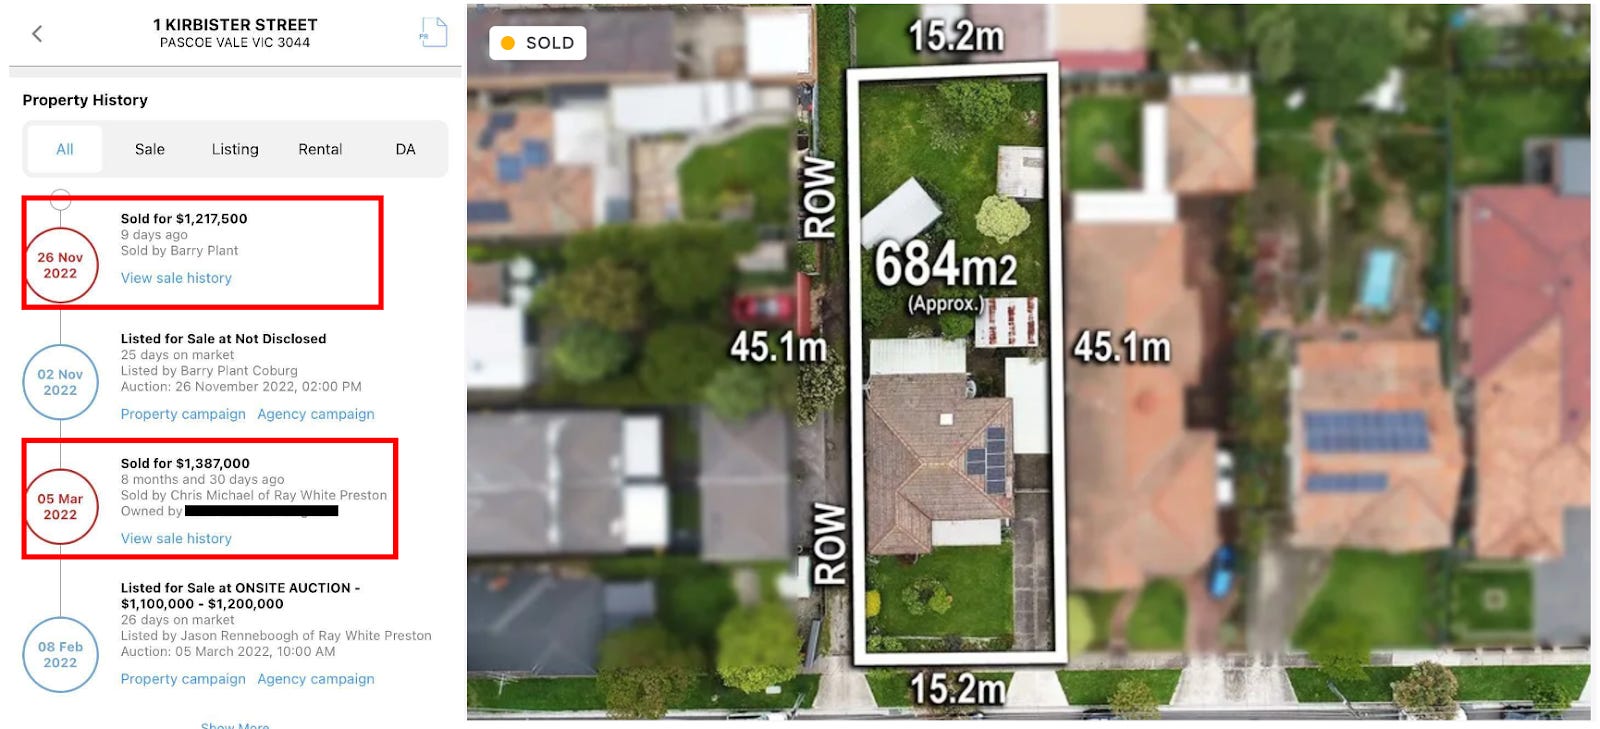
Address: 1 Kirbister Street Pascoe Vale, VIC, 3044
Recent sale: $1,217,500 - November 2022
Previous sale price: $1,387,000 - March 2022
The vendor here lost ~12% on this property, and that is before accounting for any transaction costs.
If we add in the stamp duty paid on purchase, agent fees paid on the sale and the interest costs during the ownership period and the loss quickly climbs to >20%.
Assuming the buyer purchased with a 20% deposit, any equity in that purchase may well be gone.
All of this happened in less than 9 months with the purchase being made in March and the sale happening in November.
This is likely an example of a buyer who jumped the gun and tried to “buy the dip” only to see the cost of servicing a mortgage get worse and prices continue to fall.
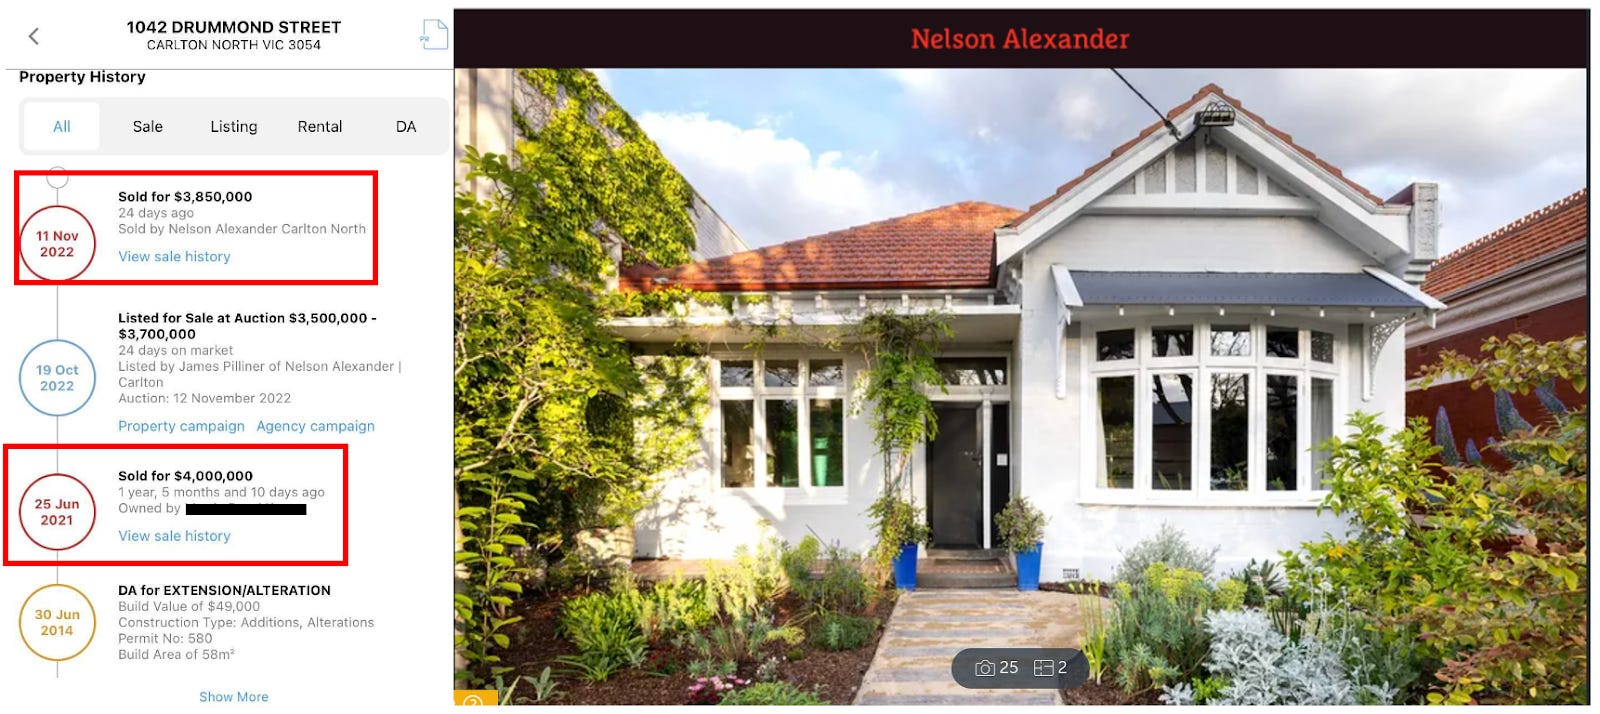
Address: 1042 Drummond Street, Carlton North, VIC 3054
Recent sale: $3,850,000 - November 2022
Previous sale price: $4,000,000 - June 2021
After considering agents fees and stamp duty the vendor here is ~12% worse off.
The reason this one stands out is that the 12% has a $ value loss of almost half a million $ at ~$450,000 to $500,000.
Enough of a loss to buy a home cash in some parts of Melbourne.
The worst part here is that this is a suburb that real estate agents and property consultants would have told the buyer is a no brainer purchase.

Address: 160 Ellesmere Road, Gymea Bay, NSW 2227
Recent sale: $3,900,000 - Nove 2022
Previous sale price: $3,900,000 - April 2022
A loss of ~17% after stamp duties and agents fees are considered.
A modest fall compared to some of the other properties we featured this week but the $ value figure is one of the worst at over half a million $ - our estimate is a loss of ~$645,000.

Address: 3 Neilson Street, Granville, NSW 2142
Recent sale: $888,000 - November 2022
Previous sale price: $898,000 - June 2015
While the loss here was small when compared to other sales we have seen, the key takeaway here is the difference in price versus June 2015.
This property delivered a net loss to its owner after almost 8 years of ownership and is an example of property prices moving back to levels that very few think is possible.
The key learning here is that while Interest rates are back to 2013 levels, prices are only just starting to adjust to historical averages in line with the cost of borrowing.
We expect to see more reversions to historical prices like this across more ‘A+ grade postcodes’ over the coming months.

Address: 34 Merrin Crescent, Wonthaggi, VIC 3995
Recent sale: $460,000 - November 2022
Previous sale price: $578,500 - October 2021
After consider agents' fees, stamp duties and interest the losses on this are nearing 30%+.
All of this in just over 12 months of ownership.