

Real estate hall of shame
Real estate hall of shame
A flippers nightmare…

Real estate hall of shame - Part 2
What’s on our mind: RBA hitting the brakes on rate rises. Property investing “Hall of shame” part two and an update on mortgage interest rates.
What happened this week: Unemployment in Australia remains near record lows at 3.5%.
What are we watching next week: Australian inflation numbers, Bank Of Canada’s cash rate decision.
Prelude:

What’s on our mind:
It's been a few weeks since our last email, but a lot has happened.
The RBA increased its cash rate to 2.6%
The US cash rate now sits at 3.25%.
The New Zealand Central bank has a cash rate of 3.5%.
The Canadian cash rate also increased to now sit at 3.25%.
All four central banks are signalling more rate hikes into the future, albeit with smaller increases than the ones we have seen over the past few months.
This means that cash rates globally will go higher in the short-medium term.
However, the pace at which our central bank (the RBA) is willing to increase Australia’s policy rate, with the central bank opting for a 0.25% increase at its last board meeting.
This move by the RBA surprised everyone (including us).
After all, if we are to believe that the RBA increases cash rates to fight Inflation, then why is the RBA slowing down the pace of rate hikes when the latest inflation print was still 6.1%?
We think it's because the cracks are starting to appear in the Australian property market, and the RBA is afraid that more rate hikes will make the situation a whole lot worse.
Australian households are one of the most leveraged in the world, with a large chunk of this debt tied to residential/commercial real estate.
For some context, Australians rank second behind Switzerland for the most indebted households, with a debt-to-GDP ratio of 120%.
This makes Australians highly sensitive to changes in borrowing costs, with every incremental hike in the cash rate translating to $$$ flowing out of Australian’s pockets.
This naturally decreases spending/purchasing power.
The reduction in spending power aside, higher interest rates are leading to falls in property prices.
These price falls bring a slowdown in the expansion of credit which reduces economic activity - this is what we think the RBA is most afraid of.
The armageddon scenario where credit growth slows (or even worse. goes negative), the credit markets freeze up, and the domestic economy implodes.
We think that the RBA is starting to see the initial signs of the Australian economy heading towards this worst-case scenario credit slowdown and is trying to get in front of it by slowing down the pace of rate hikes.
This reinforces our view that the RBA is less worried about inflation than it is about the property market and the AUD exchange rate.
To make matters worse for the RBA, the AUD is also trading near March 2020 levels at 63.5c versus the US$.
With a collapsing currency and high inflation, the RBA is under as much pressure as it could be to increase rates and increase them significantly.
Instead, the RBA is decreasing the magnitude of hikes and signalling a lower peak… go figure...
With this in mind, we are doing part 2 of our Real estate “hall of shame” - a snapshot into RBA governor Phil Lowe’s worst nightmares.
This week’s “Hall of Shame” -
The purpose of this isn't to parade poor outcomes for vendors. It is more so to try and paint a holistic picture for readers.
It’s easy for a spruiker to say that the price of a property hasn't moved that much, but that doesn't take into account interest costs, stamp duties, costs of ownership, maintenance or agent fees.
Even if the price hasn't moved nominally, the financial outcomes for “investors” may be worse than things look on paper…
That said, even on paper, the numbers can sometimes look grim.
We expect this list to become much more exhaustive over the coming months, so be on the lookout for future updates from us.
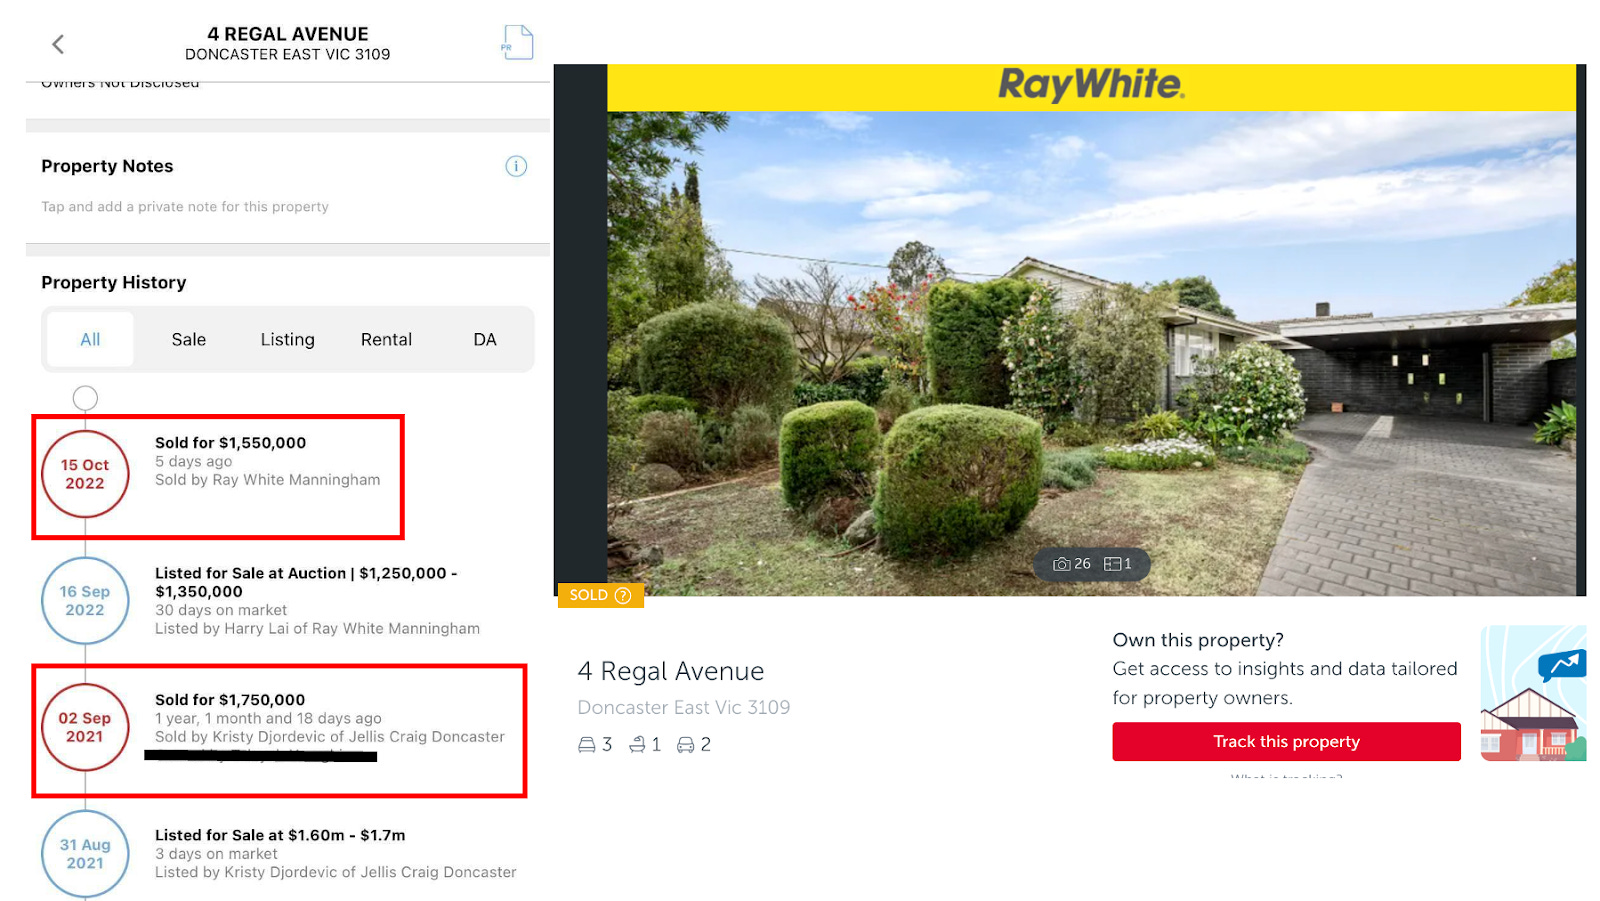
Address: 4 Regal Avenue, Doncaster East, VIC 3109
Recent sale: $1,550,000 - October 2022
Previous sale price: $1,750,000 - September 2021
The first thing to note here is how the vendor purchased it for $1,750,000 and, almost a year later, was advertising it with a lower range guidance of $500,000 less than what they paid for it.
The vendor here lost ~12% on this property, and that is before accounting for any transaction costs.
If we add in the stamp duty paid on purchase, agent fees paid on the sale and the interest costs during the ownership period, the loss quickly climbs to >22%.

Address: 11/24 Park Street, Moonee Ponds, VIC 3039
Recent sale: $670,000 - September 2022
Previous sale price: $710,000 - April 2021
The vendor here lost ~6% on this property, and that is before accounting for any transaction costs.
If we add in the stamp duty paid on purchase, agent fees paid on the sale and the interest costs during the ownership period, the loss quickly climbs to >15%.
This is a loss significant enough to wipe out all of the homeowner’s equity (assuming they paid a 20% deposit).
What’s more important here is that the property is located in what most property investors would call a “blue-chip suburb” in one of its most exclusive pockets (where free-standing homes sell for $3-4M+).
This ^ goes against the narrative that “blue-chip suburbs” are immune to losses.
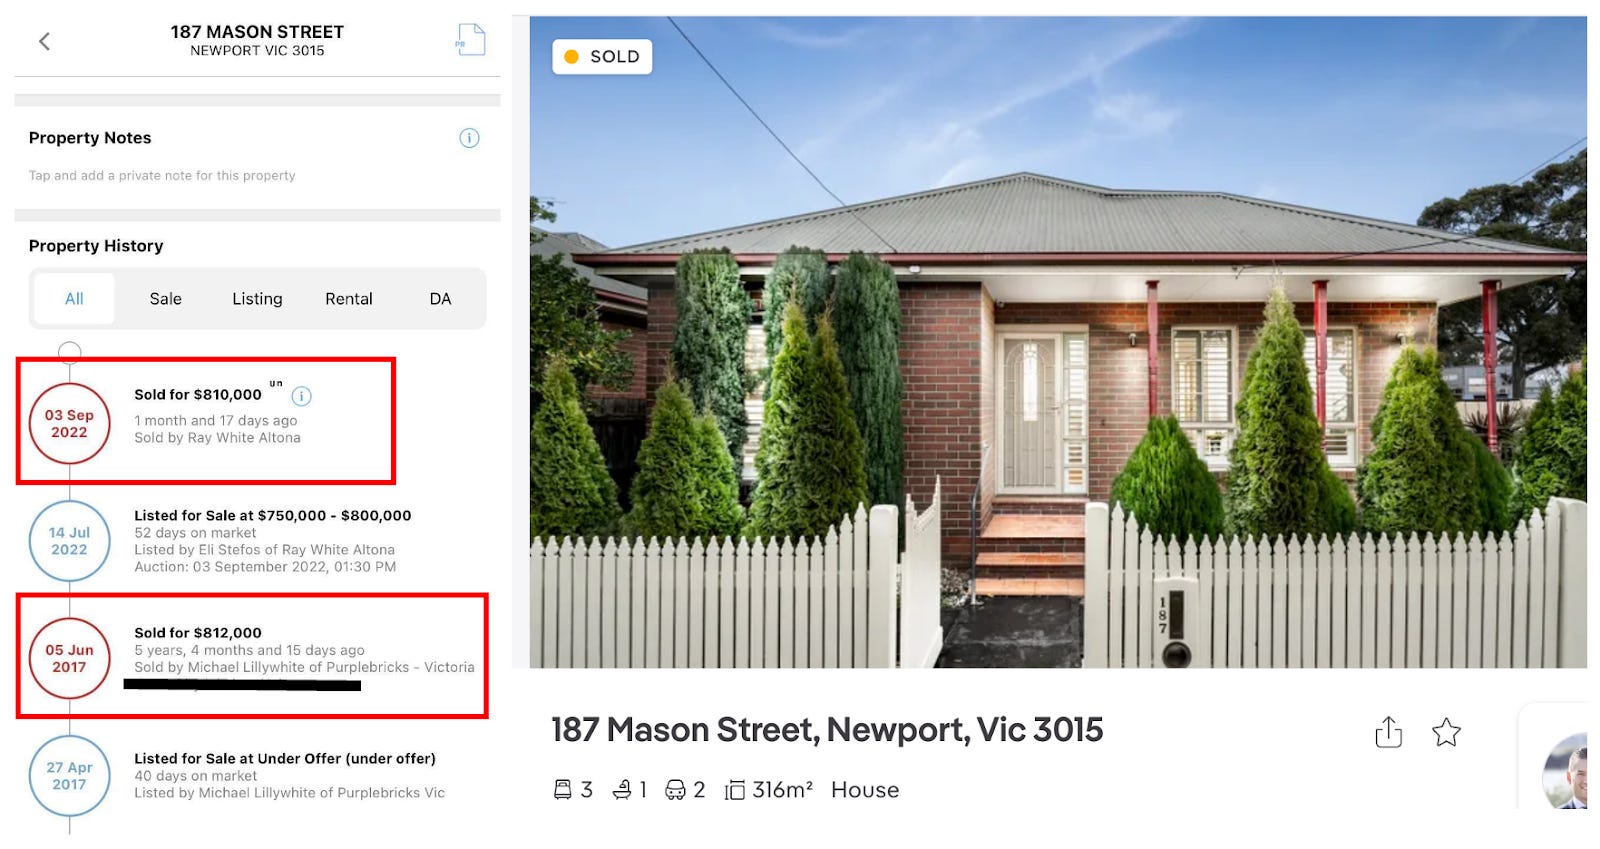
Address: 187 Mason Street, Newport, VIC 3015
Recent sale: $810,000 - September 2022
Previous sale price: $812,000 - June 2017
A modest nominal loss here, but once we consider agents' fees, stamp duties and interest, the losses on this are nearing 5-7%.
Worst of all, for this vendor, the ownership period is almost five years.
The elephant in the room on this is the vendor's massive “opportunity cost” for the five-year ownership period.
For example, the ASX 200 index is up ~20% over that same period, and the S&P 500 (the US’s main stock index) is up ~50%.
Of course, this is never talked about when it comes to property…
⚠️ Fun fact for those who have read up to here ⚠️
If you purchased $25,000 in Realestate.com.au shares in Jan 2008 (~$3.50 per share), that same investment would be worth $857,000 today - a 33x return.
Over that same period, Sydney property prices are up ~3x.
This is why we think “opportunity cost” matters.
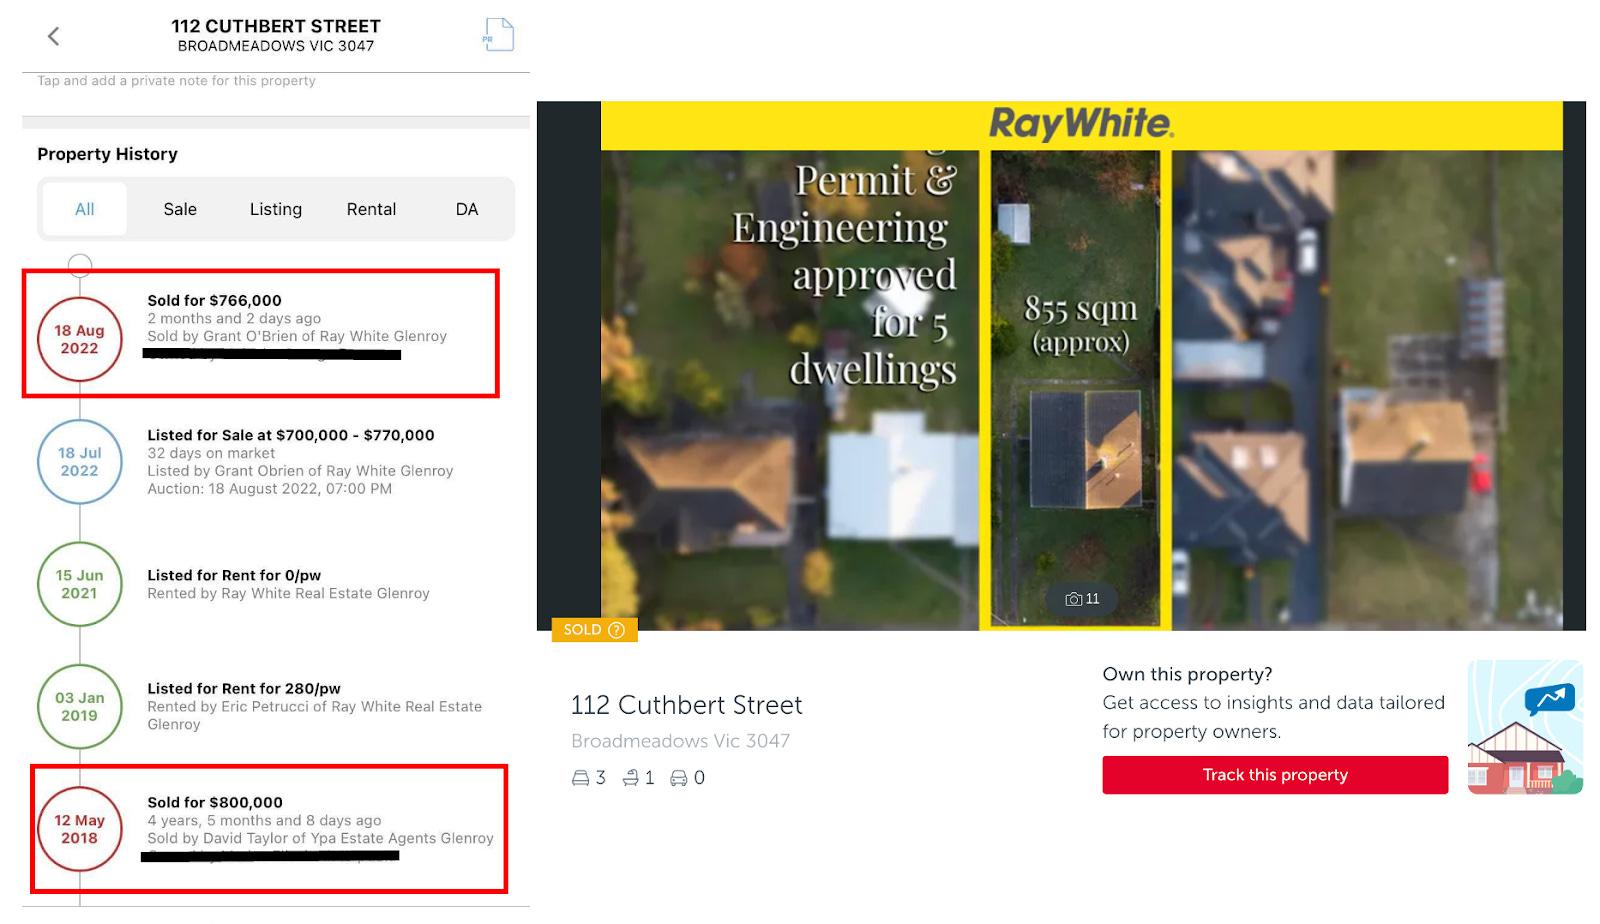
Address: 112 Cuthbert Street, Broadmeadows, VIC 3047
Recent sale: $766,000 - August 2022
Previous sale price: $800,000 - May 2018
This transaction is relatively unique and should be a warning for those thinking that by doing a renovation or getting some plans and permits, there is no guarantee this additional spending will be reflected in a future sale price.
Here, the vendor seems to have gone through a lengthy (and expensive) town planning process and STILL received a lower price than what was initially paid for the property.
After all the costs, including stamp duties, agent commissions, interest and planning fees, are considered, we suspect a $150-200,000 loss - almost ~25%.

Address: 9B Valiant Street, Abbotsford, VIC 3067
Recent sale: $880,000 - October 2022
Previous sale price: $900,000 March 2021
Another modest loss nominally, but this property also sits in what is deemed a “blue chip” suburb.
After stamp duties and agent fees are considered, the loss here is already >5% (NOT including interest).
An update on mortgage rates:
In a previous article, we did a deep dive into how banks determine mortgage interest rates.
📝 (To read that article, click the following link: How do mortgage rates rise)
With the cash rate changed, we have updated our bank funding costs spreadsheet to try and estimate where mortgage rates sit in the current environment.
The formula we put together was as follows:
(1) Funding costs 3.33% + (2) Net interest margin 2.25% = (3) Mortgage rate offered to new borrowers is 5.58%.
To work out funding costs, we used the following:
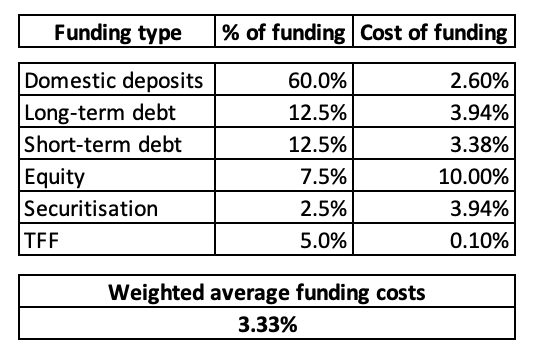
We used a ~10-year average of 2.25% to calculate the net interest margin.

We then add the two together to calculate mortgage rates and get 5.58%.
Mortgage rates now sit at almost 3x where they were in 2021.
We think this will start to have a more significant impact on property prices over the coming months.
Watch this space.